
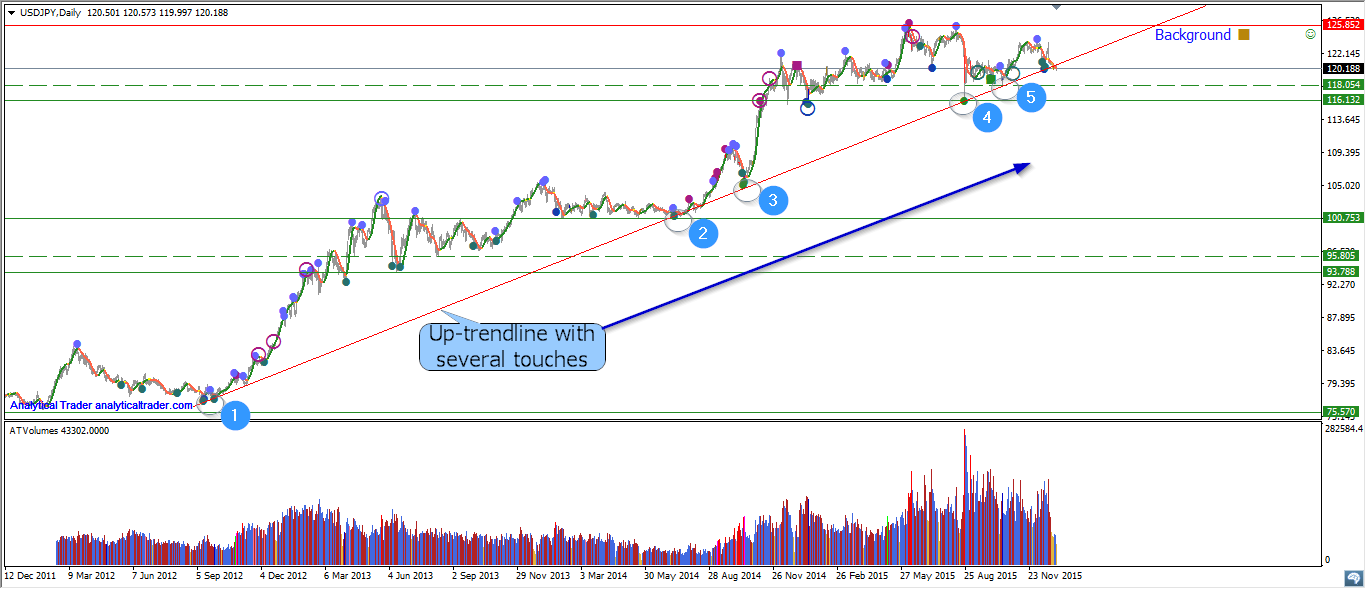
 In a big picture (daily timeframe) USDJPY is moving upwards (Mark-up
phase). You see that it is possible to draw an up-trendline with several
touches (5 times market touched this line).
In a big picture (daily timeframe) USDJPY is moving upwards (Mark-up
phase). You see that it is possible to draw an up-trendline with several
touches (5 times market touched this line).
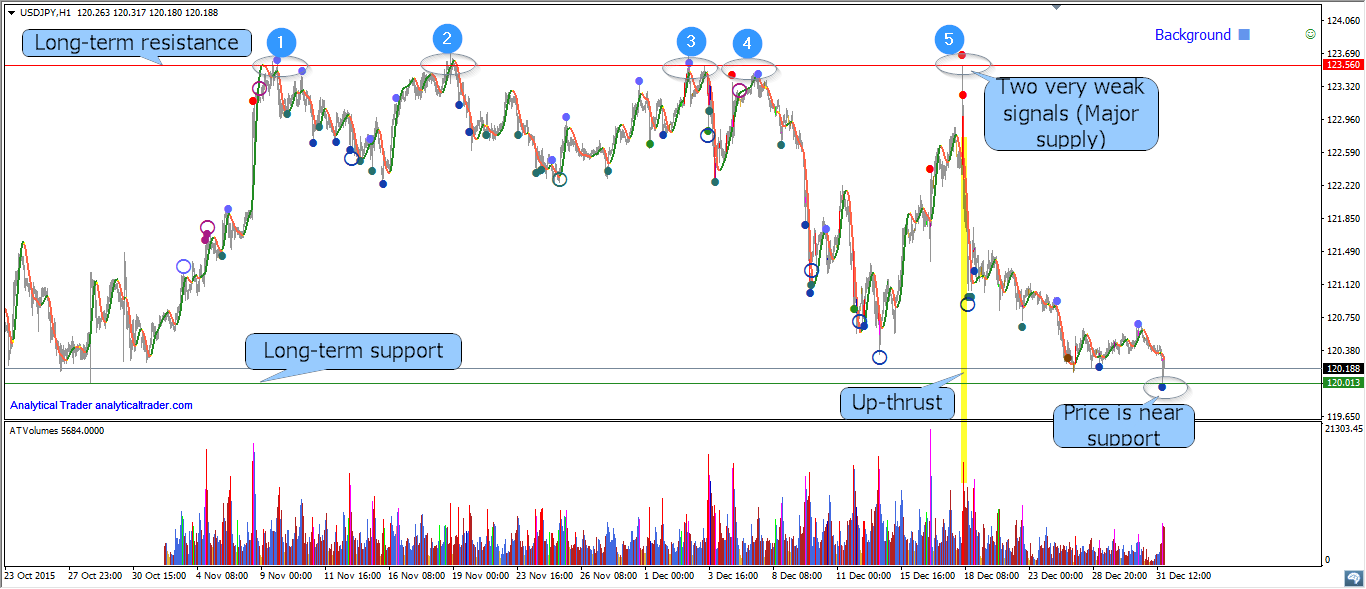
In H1 timeframe we have 2 important levels: resistance and support.
Long-term resistance. This level has been showing itself during long period. Several times the market turned near this level. The longer resistance is working, the stronger it becomes. Now it will require effort to cross this line. Effort can be recognized as a high activity (high volume) or no interest (no demand/no supply) in the market (can be analyzed through volume spread analysis).
Last time we had an up-thrust near this resistance. Up-thrust is a wide spread up-bar, accompanied by high volume, to then close on the low. Up-thrusts are usually seen after a rise in the market, where the market has now become overbought and there is weakness in the background. Up-thrusts are frequently seen just before a down-move. Analytical Trader has detected two very weak signals (Major Supply) in this place and later the market moved down to the long term support.
Now the price has reached the long-term support and VSA indicator detected strong signal (background is strong). It is possible that the market will reverse in this place.


")