
There is a very interesting pattern in AUDUSD chart. Movement is limited by two important lines:
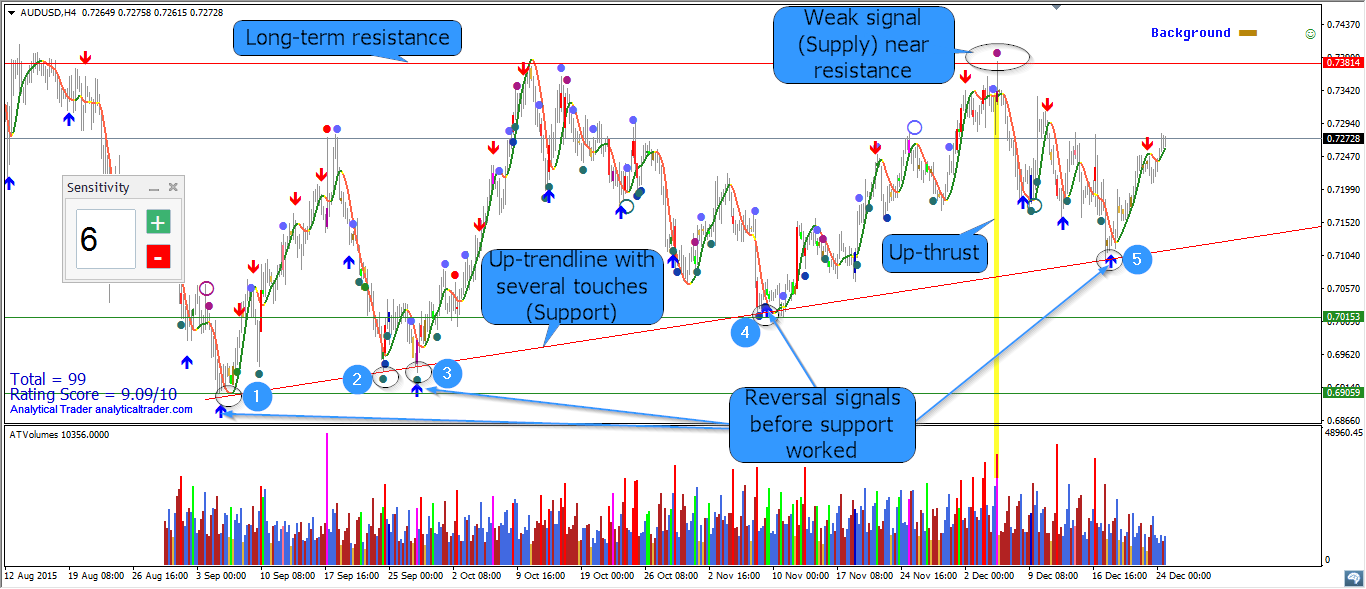
1. Upper limit: long-term resistance
On 04.12.15 we had high activity on the top of the market when price was near the level of previous high (look at the volume and spread). Then up-thrust happened. Up-thrusts can be recognised as a wide spread up-bar, accompanied by high volume, to then close on the low. Up-thrusts are usually seen after a rise in the market, where the market has now become overbought and there is weakness in the background. Up-thrusts are frequently seen just before a down-move. Analytical Trader has also detected weak signal (Supply) on this bar. The market started to move down. I want to draw your attention that high of up-thrust is slightly higher than long-term resistance (previous maximum). Usually traders place stop-losses on this level or buy-stops to open a long trade in this place. In our case the stop losses were activated, long trades were opened, but the market has immidiately turned down leaving the traders with losses. This is a quite reliable setup after which we can expect prices to fall.
2. Lower limit (support): up-trendline with several touches (already 5 times market turned near this line)
The longer support is showing itself, the stronger it becomes. Reversal signals appeared each time before market turned.
Now there is a high probability that prices again approach the long-term resistance. This pattern is also known as an ascending triangle. Eventually market will break one of these lines. VSA and Reversal indicators will help us understand the direction of break-out. Usually it is accompanied by high volume and wide spread bars.


")