
Dollar Index Long-Term Technical Analysis: more bullish than expected
3 December 2015, 06:11

0
1 212
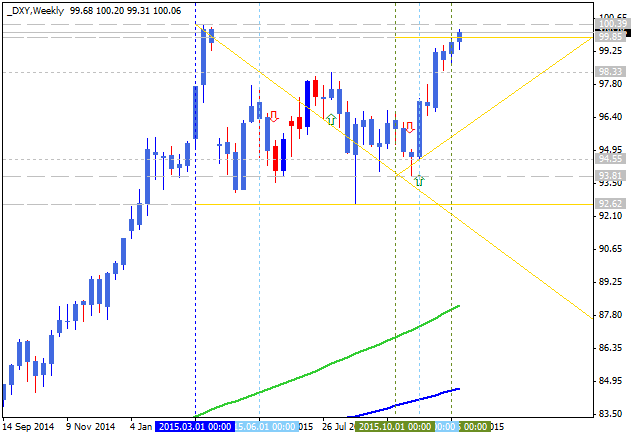
The price is located above 100 period SMA (100 SMA) and 200
period SMA (200 SMA) within the following
support/resistance levels:
- 100.39 resistance level located far above 100 SMA and 200 SMA in the primary bullish area of the chart with R3 Pivot level at 107.47 as the next bullish target, and
- 92.62 support level located within 100 SMA/200 SMA on the border between the primary bearish and the primary bullish trend.
RSI indicator is estimating the primary bullish to be continuing.
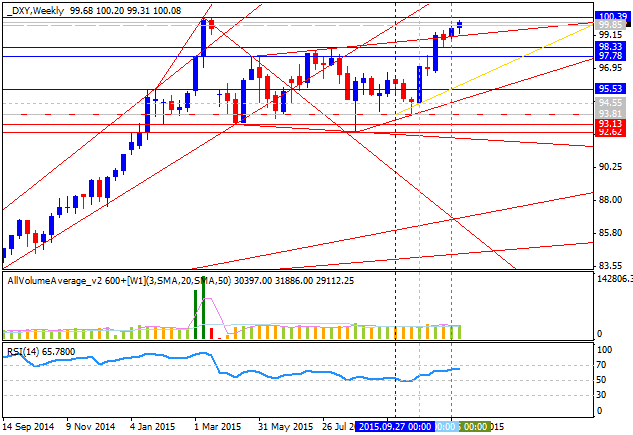
- If the price will break R3 Pivot level at 107.47
resistance level so the bullish trend will be continuing.
- If price will break 92.62 support so the local downtrend as the secondary correction within the primary bullish market condition will be started with the good possibility to the reversal to the bearish market condition.
- If not so the price will be ranging within the levels.
| Resistance | Support |
|---|---|
| 100.39 | 93.81 |
| 107.47 | 92.62 |


 Trading Guide")

")