
S&P 500 Long-Term Technical Analysis: on the border between the bearish and bullish
2 December 2015, 12:11

0
1 174
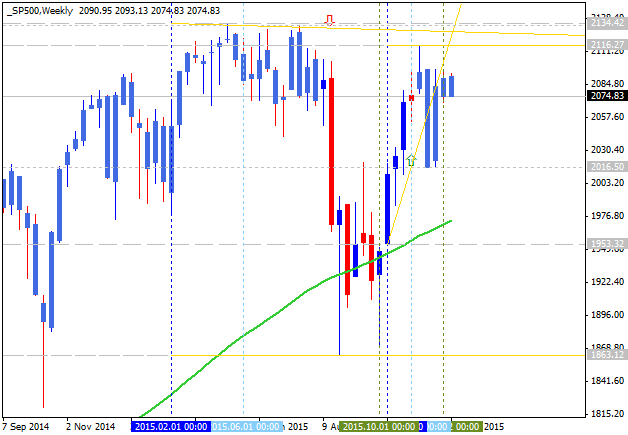
The price is located above 100 period SMA (100 SMA) and 200 period SMA (200 SMA) with the ranging within the following support/resistance levels:
- 2134.4 resistance level located above 100 SMA and 200 SMA in the primary bullish area of the chart, and
- 1863.1 support level located within 100 SMA and 200 SMA on the border between the primary bearish and the primary bullish trend.
RSI indicator is estimating the secondary ranging market condition.
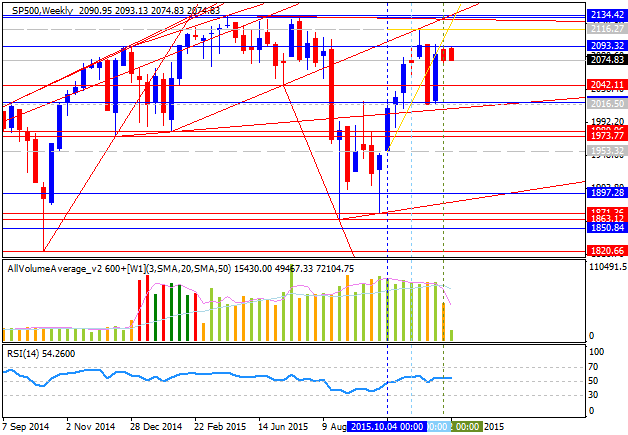
- If the price will break 2134.4
resistance level so the bullish trend will be continuing.
- if price will break 1863.1 support so the bearish reversal will be started with the secondary ranging.
- if not so the price will be ranging within the levels.
| Resistance | Support |
|---|---|
| 2116.2 | 1863.1 |
| 2134.4 | N/A |


")

")