

EUR/USD: ranging on reversal. The pair is waiting for direction for ranging near 100 period SMA (100 SMA) and 200 period SMA (200 SMA) within the following key support/resistance level:
- 1.0757 resistance level located above 100 SMA/200 SMA in the bullish area of the chart, and
- 1.0713 support level located below 100 SMA/200 SMA in the bearish area.
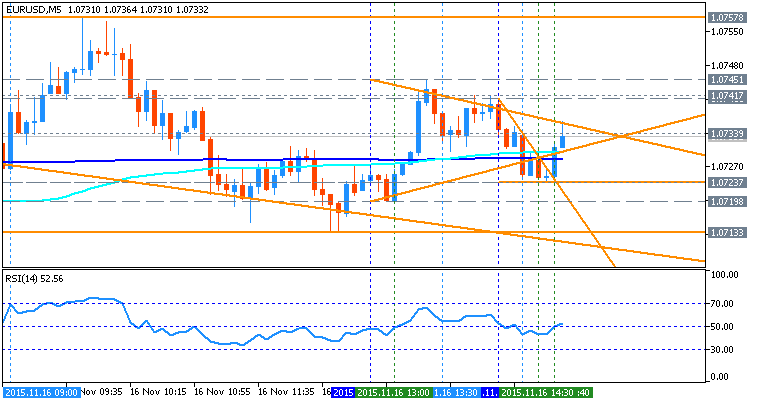
RSI indicator is estimating the intra-day bullish reversal for the pair by direction.
- if the price breaks 1.0757 resistance so the price will be on the primary bullish market condition;
- if the price breaks 1.0713 support level so we may see the bearish reversal of intra-day price;
- if not so the price will be moved within the channel.
| Resistance | Support |
|---|---|
| 1.0757 | 1.0713 |
| 1.0745 | N/A |


![[XAUUSD]: Weekly Liquidity Activation Points (timings), June 29 - July 3, 2026](https://c.mql5.com/6/1014/splash-preview-772062.png "[XAUUSD]: Weekly Liquidity Activation Points (timings), June 29 - July 3, 2026")
