

W1 price is above 200 period SMA (200 SMA) and 100 period SMA (100 SMA) for the primary bullish market condition with the secondary ranging within the following key support/resistance levels:
- 2134.42 key resistance level located far above 100 SMA/200 SMA in the primary bullish area of the chart, and
- 1863.12 key support level located between 100 SMA and 200 SMA in the ranging bearish area of the chart.
The bearish reversal level for the price is 1953.32, it means the following: if the price will break this level from above to below so we may see the reversal to be started from the primary bullish to the primary bearish condition with the secondary ranging. Ascending triangle pattern was formed by the price for the bullish trend to be continuing.
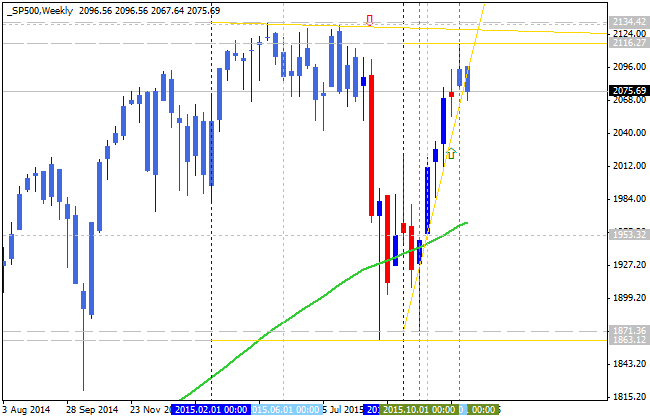
If the price will break 1953.32 support level so the bearish reversal will be started.
If the price will break 1863.12 key support level so the price will be fully reversed to the bearish condition with the secondary ranging trend.
If the price will break 2134.42 key resistance level
from below to above so the primary bullish trend will be continuing.
If not so the price will be ranging within the levels.
| Resistance | Support |
|---|---|
| 2116.27 | 1953.32 |
| 2134.42 | 1863.12 |
Trend:


")
![[iVISTscalp5]: TSI — Timing Strength Index](https://c.mql5.com/6/1015/splash-preview-772243.png "[iVISTscalp5]: TSI — Timing Strength Index")
![[XAUUSD]: Weekly Liquidity Activation Points (LAP), July 6 - July 10, 2026](https://c.mql5.com/6/1015/splash-preview-772241.png "[XAUUSD]: Weekly Liquidity Activation Points (LAP), July 6 - July 10, 2026")