

0
1 029
Weekly price is on bearish breakdown for crossing Ichimoku cloud border line namely Senkou Span line: the price is located inside Ichimoku cloud for the bearish ranging market condition between 17155 key support level and 19195 key resistance level.
- Chinkou Span line is located to be below the price and indicating the bearish breakdown by direction.
- 'Reversal' Senkou Span line (which is the virtual border between the primary bullish and the primary bearish on the chart) is near and above the price which makes bullish reversal to be very possible in the near future.
- The nearest resistance level is 19195, and the next level is 20930.
- Absolute Strength indicator is estimating the bearish condition to be continuing.
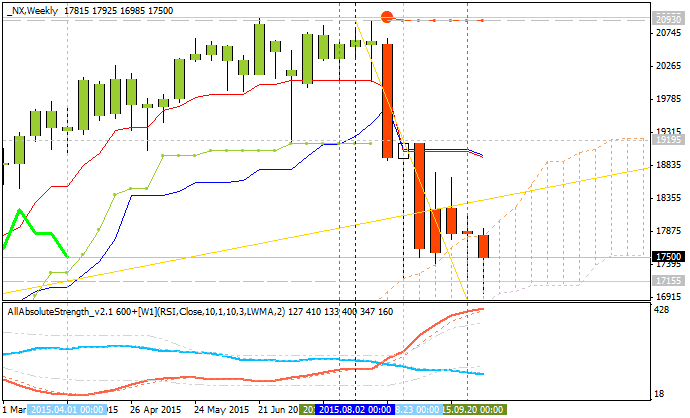
If W1 price will break 17155 key support level on close W1 bar so the primary bearish trend will be continuing.
If W1 price will break 19195 key resistance level so the bullish trend will be started.
If not so the price will be ranging within the levels.
Trend:


")
 & AMD Framework")