
USD/JPY Intra-Day Technical Analysis - waiting for bearish breakdown
22 September 2015, 14:43

0
1 713
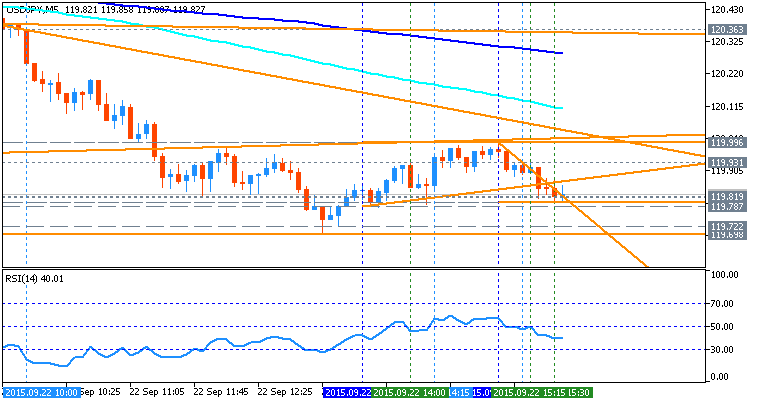
M5 price is located below SMA with period 100 (100-SMA) and below SMA with the period 200 (200-SMA) for trying to break descending triangle patterns with 119.81 support level and 119.69 support level. The key reversal resistance level is 120.36 located near and above 100-SMA/200-SMA in the primary bullish area of the chart.
- If the price will break 120.36 resistance level so we may see the reversal of the price movement to the primary bullish market condition with secondary ranging.
- if price will break 119.69 support so the bearish trend will be continuing.
- if not so the price will be ranging within the levels.
| Resistance | Support |
|---|---|
| 120.36 | 119.81 |
| N/A | 119.69 |
- Recommendation to go short: watch the price to break 119.69 support level for possible sell trade
- Recommendation to go long: watch the price to break 120.36 resistance level for possible buy trade
- Trading Summary: ranging
SUMMARY : ranging


")
 & AMD Framework")