
USDJPY Price Action Analysis - two ascending triangle patterns formed
17 August 2015, 18:11

0
229
W1 price is located above 200 period SMA (200-SMA) and above 100 period SMA (100-SMA) for the primary bullish market condition with secondary ranging between 23.6% Fibo support level at 119.93 and Fibo resistance level at 125.85:
- two ascending triangle patterns were formed by the price with 125.27 resistance and 125.85 resistance to be crossed for the bullish trend to be continuing;
- the price is ranging between 23.6% Fibo support level at 119.93 and Fibo resistance level at 125.85;
- if the price breaks Fibo resistance level at 125.85 so the bullish trend will be continuing;
- if the price breaks 23.6% Fibo support level at 119.93 so we may see the secondary correction within the primary bullish.
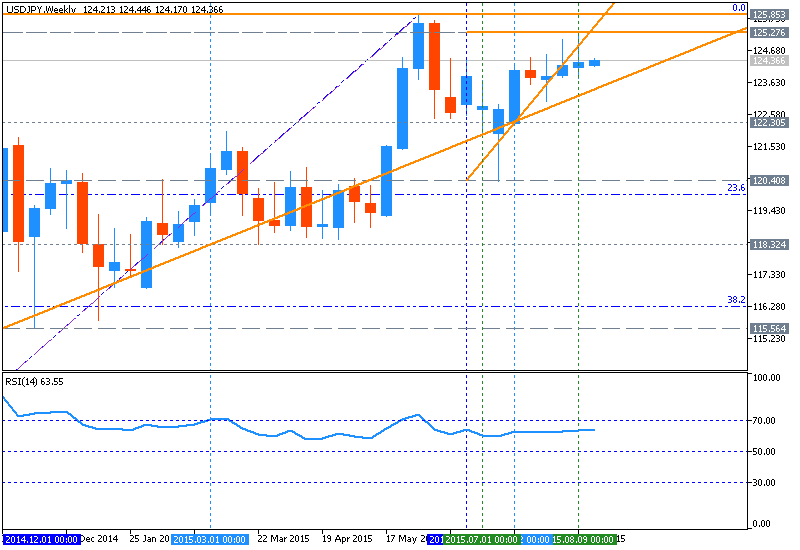
If the price will break 23.6% Fibo support level at 119.93 so we may see the correctional
movement within the primary bullish.
If the price will break Fibo resistance level at 125.85 from below to above so the primary bullish trend will be continuing with good possible breakout of the price movement.
If not so the price will be ranging between the levels.
Trend:


