
What +342% Gain Doesn't Tell You: Reading Gold Guardian's Full Story

Everyone saw the +27% week and +92% month posts.
Great headlines. Real results. But if you only look at gains, you miss the story that actually matters.
Let me show you how to read Gold Guardian's Myfxbook the way professionals do—and what most vendors hope you never analyze.
The Numbers Everyone Shares
First, the attractive metrics:
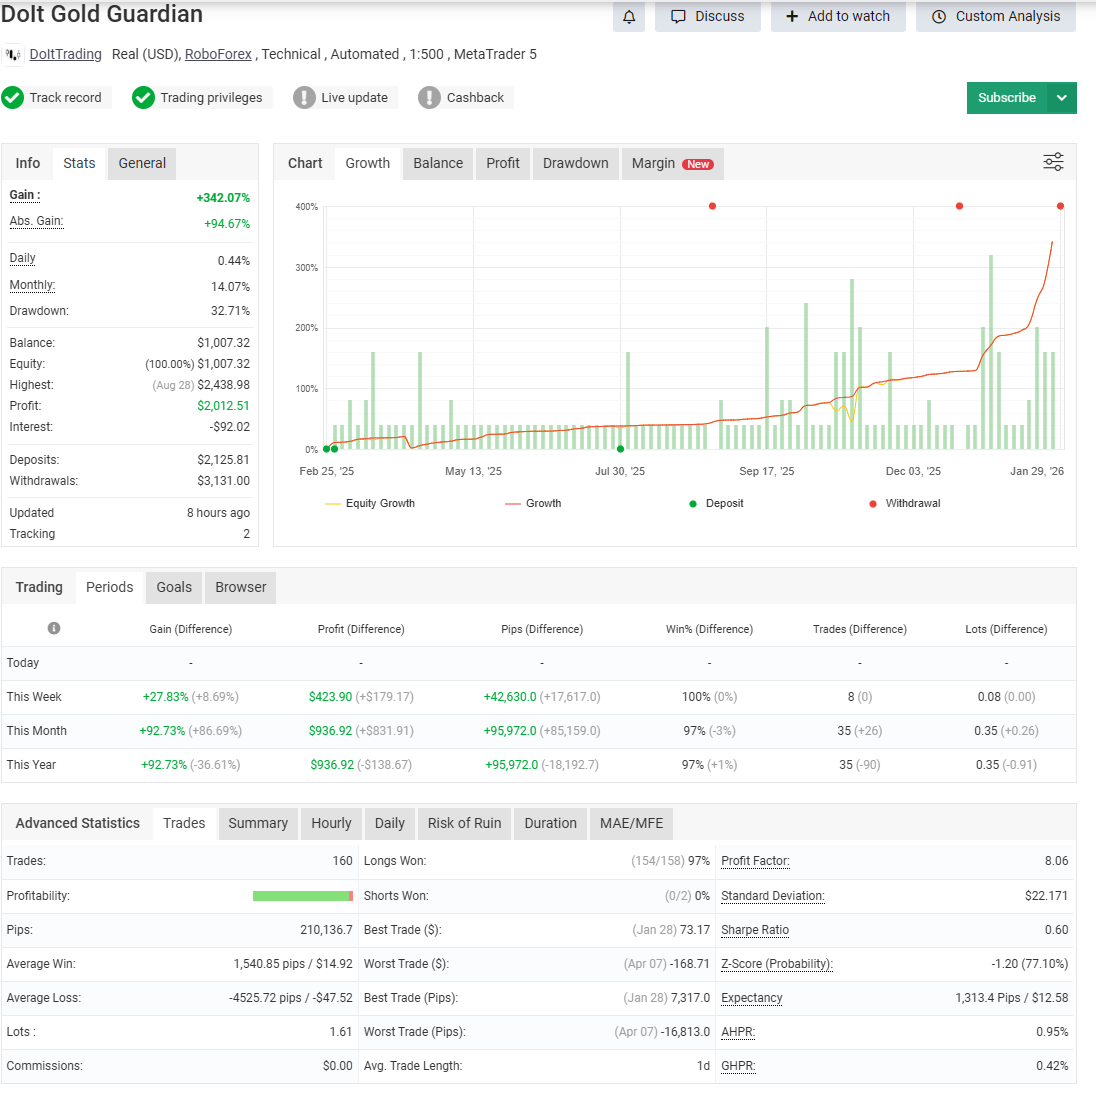
- Total Gain: +342.07%
- This Month: +92.73% (97% win rate)
- Profit Factor: 8.06
- Current Profit: $2,012.51
These numbers are real. Verified. Public. And they look fantastic.
If you stopped here, you'd think this is free money.
You shouldn't stop here.
The Number Everyone Ignores
Maximum Drawdown: 32.71%
This means at some point, the account was down 32.71% from its peak. One-third of the account value. Gone temporarily.
Now imagine you put $10,000 in this system. You'd watch your account drop to $6,729 at the worst point.
Can you handle that?
Most traders say yes when looking at the 342% gain. Most traders panic and close the EA when actually watching $3,271 disappear from their balance.
This is why drawdown is the most important metric for deciding if a system fits YOUR psychology. The gain tells you the destination. The drawdown tells you the journey.
The Metric That Matters Most
Look at these two numbers:
- Deposits: $2,125.81
- Withdrawals: $3,131.00
Withdrawals exceed deposits by over $1,000.
This is the only metric that proves a system actually produces money. Not paper gains. Not "equity curve appreciation." Actual money removed from the account and still performing.
Anyone can show a growing balance if they never withdraw. The test is: can the system survive capital extraction and keep working?
Gold Guardian passes this test. More money came out than went in. And it's still profitable.
Understanding the Win/Loss Ratio
From the data:
- Average Win: 1,540 pips
- Average Loss: -4,525 pips
Wait—the average loss is nearly 3x the average win?
Yes. And the system is still highly profitable. Here's why.
Gold Guardian uses a high win rate strategy with wider stops. It's designed to win most trades but take larger hits when it loses.
The math works because:
- With ~90%+ win rate, you have 9 winners for every loser
- 9 × 1,540 = 13,860 pips won
- 1 × 4,525 = 4,525 pips lost
- Net: +9,335 pips per 10 trades
The key: the win rate must stay high for this to work. If win rate drops to 70%, the math breaks. This is the risk of high win rate systems—they require the edge to persist.
Best vs Worst Trade
- Best Trade: $73.17 (January 28)
- Worst Trade: -$168.71 (April 07)
The worst trade is more than double the best trade. That's consistent with the wider stops approach.
April 07 was the day when everything that could go wrong, did. The system took its worst hit. And recovered.
This is what you're signing up for: exceptional weeks like January, but also days like April 07 when a single trade costs more than your best day makes.
Average Trade Length: ~1 Day
Gold Guardian isn't scalping. It's holding trades for approximately a day on average.
This means:
- Less sensitivity to spread costs than scalpers
- Exposed to overnight gaps and weekend risk
- Capturing intraday moves rather than micro-movements
For broker selection, this matters. You want stable execution but don't need the ultra-low spreads that scalpers require.
Why January Was Exceptional
+92.73% in one month is not normal. Let me be explicit about this.
January 2026 had specific gold conditions:
- High volatility with directional momentum
- Multiple clear trend days
- Reversals that created re-entry opportunities
Gold Guardian is designed for momentum. When momentum conditions appear, it performs exceptionally. When conditions are choppy, results moderate.
Expecting January every month is a recipe for disappointment. The system works over time. Individual months vary widely.
How to Use This Analysis
When evaluating ANY EA (mine or anyone else's), use this framework:
1. Check the drawdown first.
Can you psychologically handle that percentage of your account disappearing? If no, the EA isn't for you—regardless of returns.
2. Look at withdrawals vs deposits.
Has real money been extracted? Or is it just paper gains?
3. Understand the win/loss structure.
High win rate with large losses? Low win rate with large wins? Each has different psychological demands.
4. Check exceptional periods.
Are the gains concentrated in a few months? What happened during difficult periods?
5. Verify account type.
Live account? Demo? Broker verified? Green verification badge matters.
The Professional Framework
Use the 7-Point EA Checklist for any EA you're evaluating. It covers:
- Verified performance (Myfxbook, not screenshots)
- Understandable strategy logic
- Adaptive exit mechanisms
- Session filtering
- Performance across market phases
- Defined risk after losses
- Clean setup
Gold Guardian scores high on this. But so might other EAs you're considering. The checklist removes emotion from evaluation.
Where to Scale These Results
Results like these matter when they can be scaled.
I use Axi Select for scaling because:
- No challenge fees to prove myself
- Capital allocation based on actual performance
- Edge Score rewards the consistency these results demonstrate
If you're evaluating Gold Guardian for funded trading, understand that the drawdown matters more than the gain for program survival. 32% drawdown might violate some prop firm rules. Axi Select's model is more accommodating of high-return-high-drawdown strategies.
Setting Expectations
If you deploy Gold Guardian, expect:
- Exceptional months like January (+92%)
- Quiet months with moderate gains
- Drawdown periods that test your patience
- Individual trades that hurt more than your winners feel good
- Long-term positive expectancy if you don't interfere
Do NOT expect:
- January every month
- No drawdowns
- Guaranteed weekly returns
- Set-and-forget without any monitoring
Stay Updated
I share these analyses regularly—not just my EAs, but frameworks for evaluating any automated system.
Subscribe to the newsletter for weekly breakdowns on reading EA performance like a professional.
The Bottom Line
+342% gain is the headline. But the real story includes:
- 32.71% maximum drawdown (can you handle it?)
- Withdrawals exceeding deposits (proof it's real)
- Average loss 3x average win (high win rate required)
- January was exceptional (don't expect it monthly)
- ~1 day average trade length (overnight exposure)
Reading an EA like a professional means seeing the complete picture. The destination AND the journey. The gains AND the drawdowns.
Gold Guardian's story includes both. Now you know how to read it.
The Myfxbook is public. The data is there. What you do with it is your decision.


")