
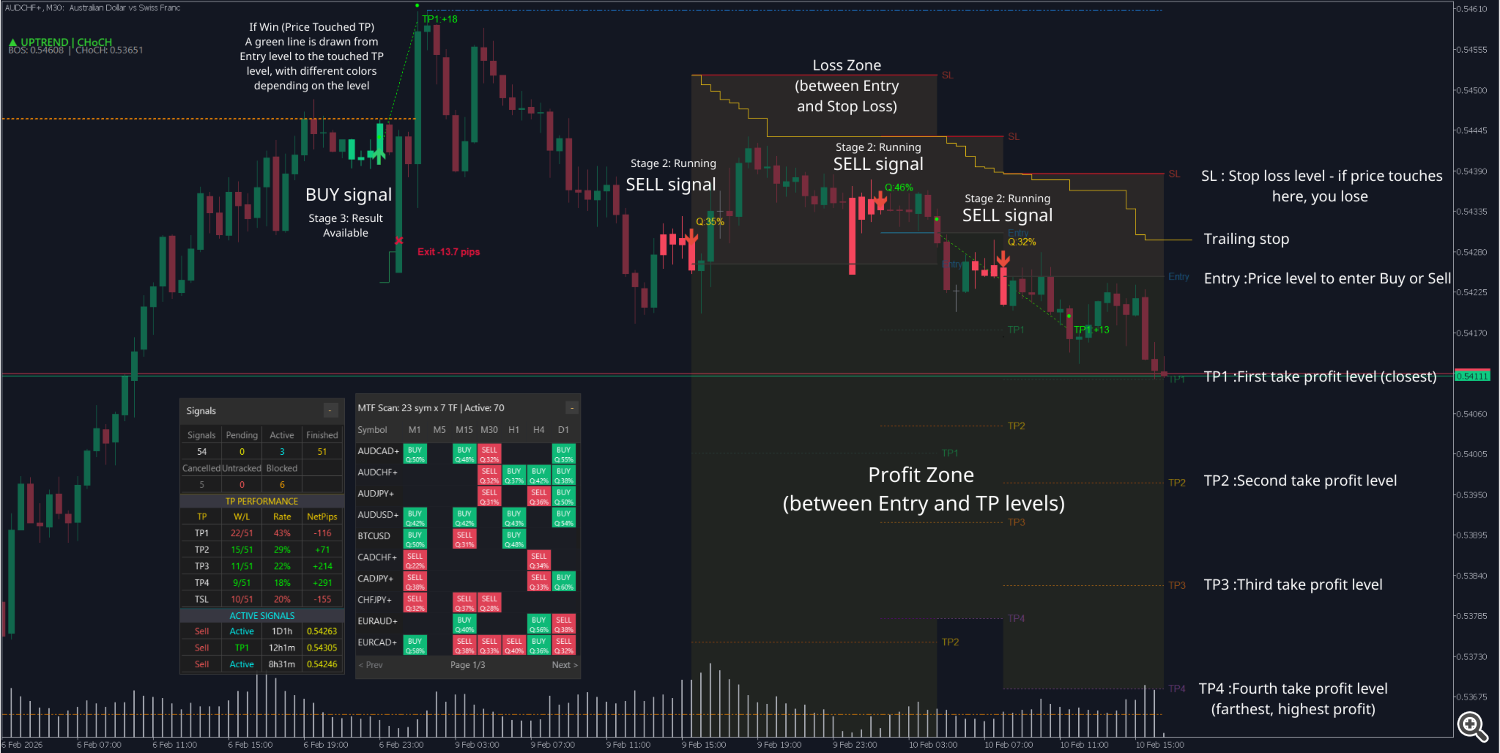
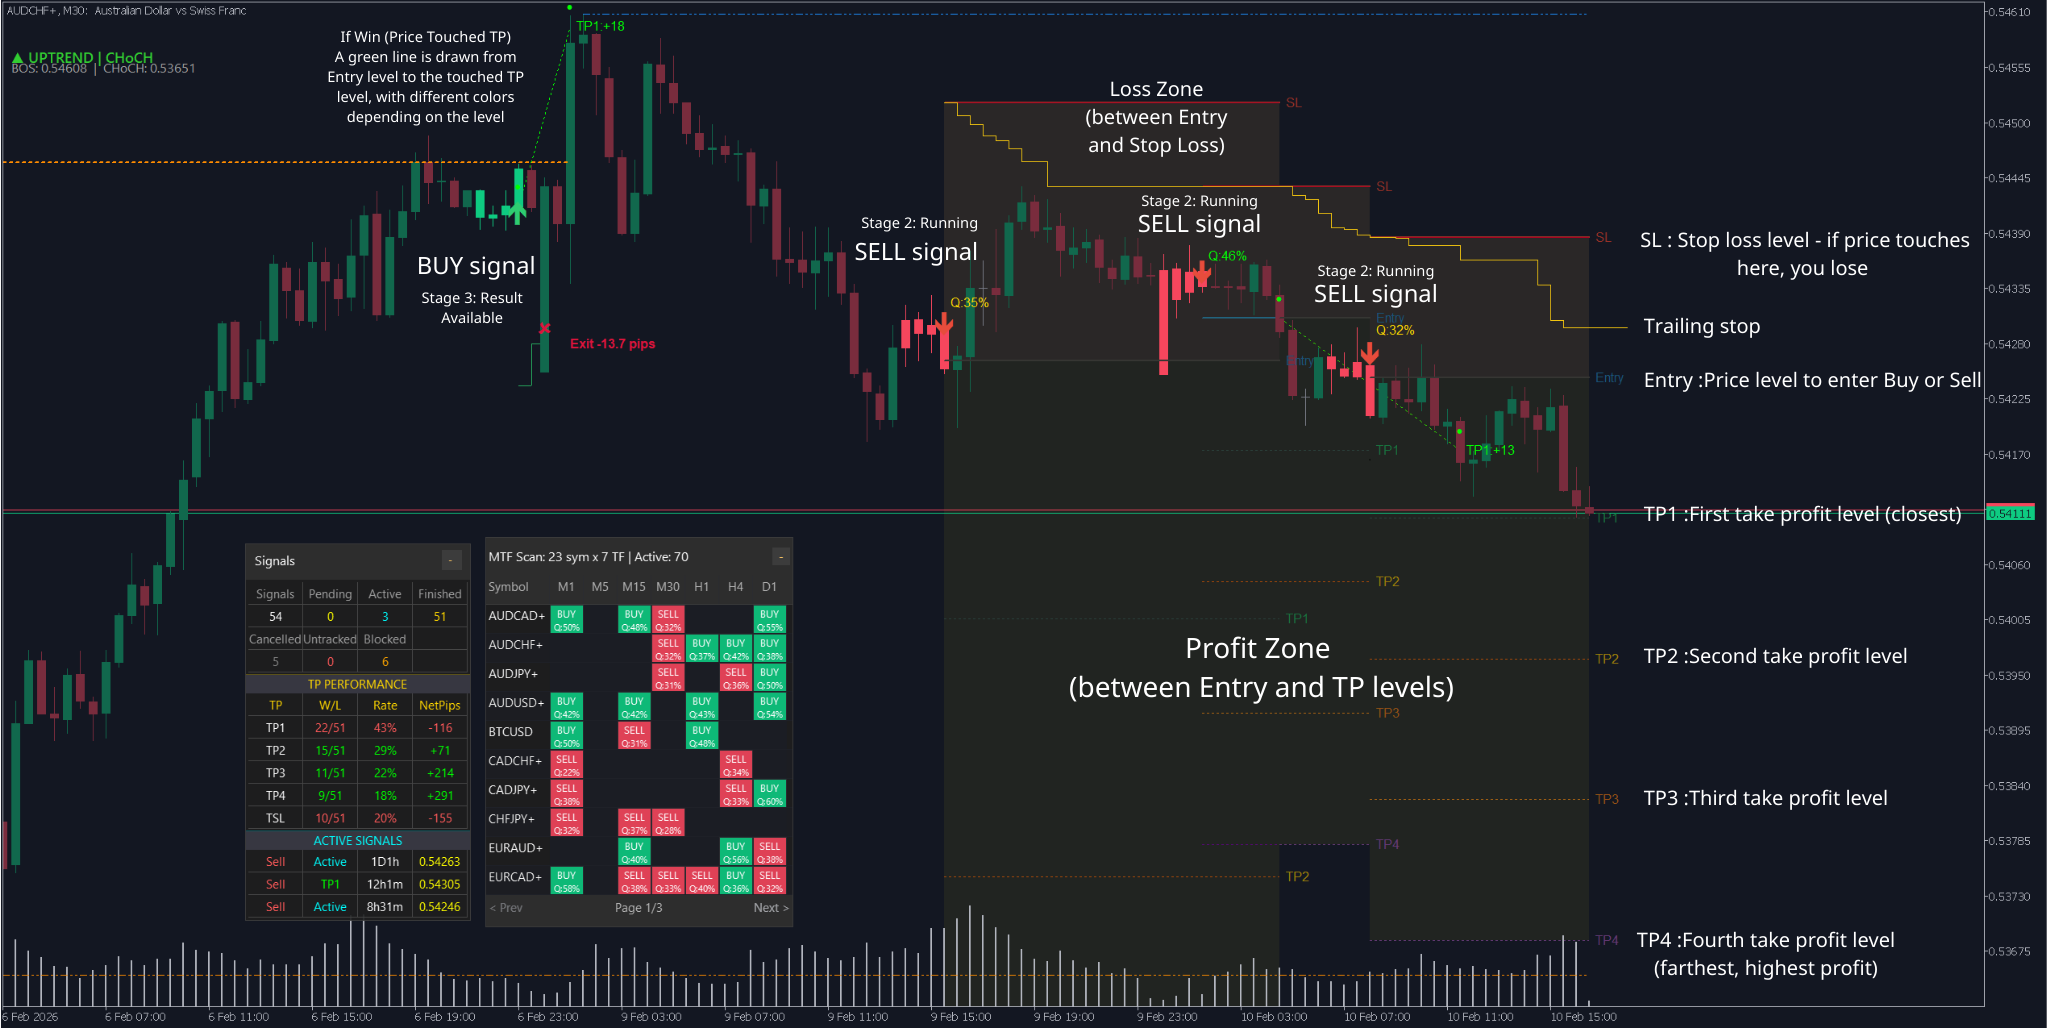
When the product detects a trading opportunity, it draws horizontal lines on the chart to show you exactly:
-
Where to enter (Entry)
-
Where to place stop loss (Stop Loss)
-
Where to take profit (Take Profit 1, 2, 3, 4)
At the same time, the product automatically tracks whether price touches these levels, records win/loss results, and displays statistics directly on the chart.
1. Lines on the Chart
1.1. Each Line Has Its Own Color for Easy Recognition
When a new signal appears, you'll see horizontal lines on the chart:
Line Color What does it mean? Entry Blue Price level to enter Buy or Sell Stop Loss Red Stop loss level - if price touches here, you lose TP1 Green First take profit level (closest) TP2 Yellow Second take profit level TP3 Orange Third take profit level TP4 Purple Fourth take profit level (farthest, highest profit) Completed Gray Signal is finished (touched TP or SL)
3. Additionally, you'll see arrows on the chart:
-
Green arrow = BUY signal
-
Red arrow = SELL signal
Tip: Choose signals with R:R ratio of 1.5 or higher. This means each win earns you more than each loss, so even with a 50% win rate, you'll still be profitable.
2. Signal Stages
Each signal on the chart goes through the following stages:
Stage 1: Awaiting Confirmation
-
Signal just appeared, lines are extending on the chart
-
You can review and prepare to enter
-
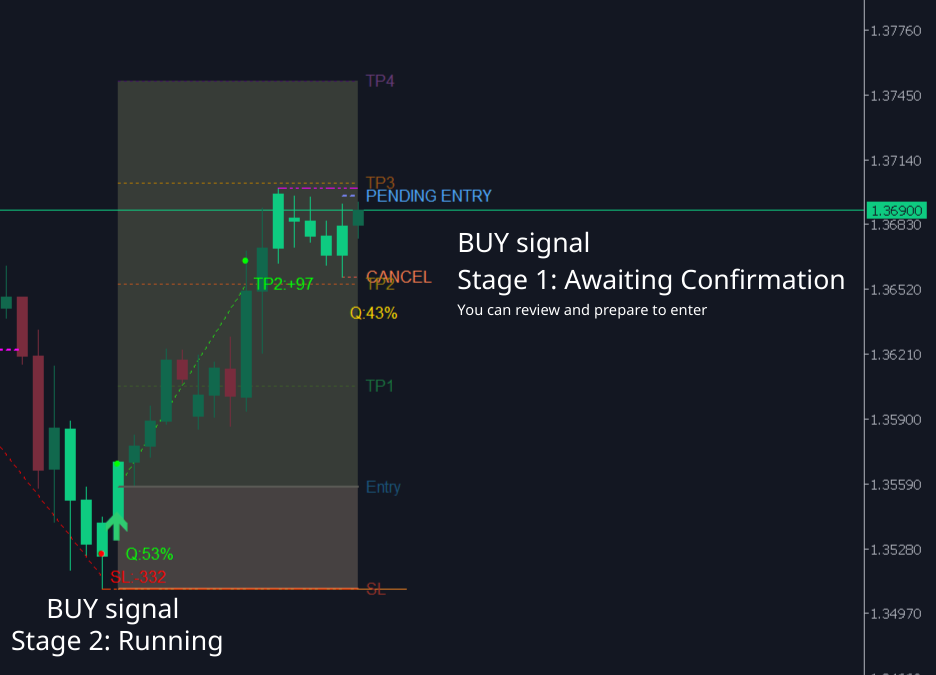
Stage 2: Running
-
Price has touched the Entry level - signal is activated
-
The product now tracks whether price will touch TP (win) or SL (loss)
Stage 3: Result Available
-
Price has touched TP or SL
-
Lines turn gray - you know immediately the signal has ended
-
Result (win/loss, how many pips) is recorded in statistics
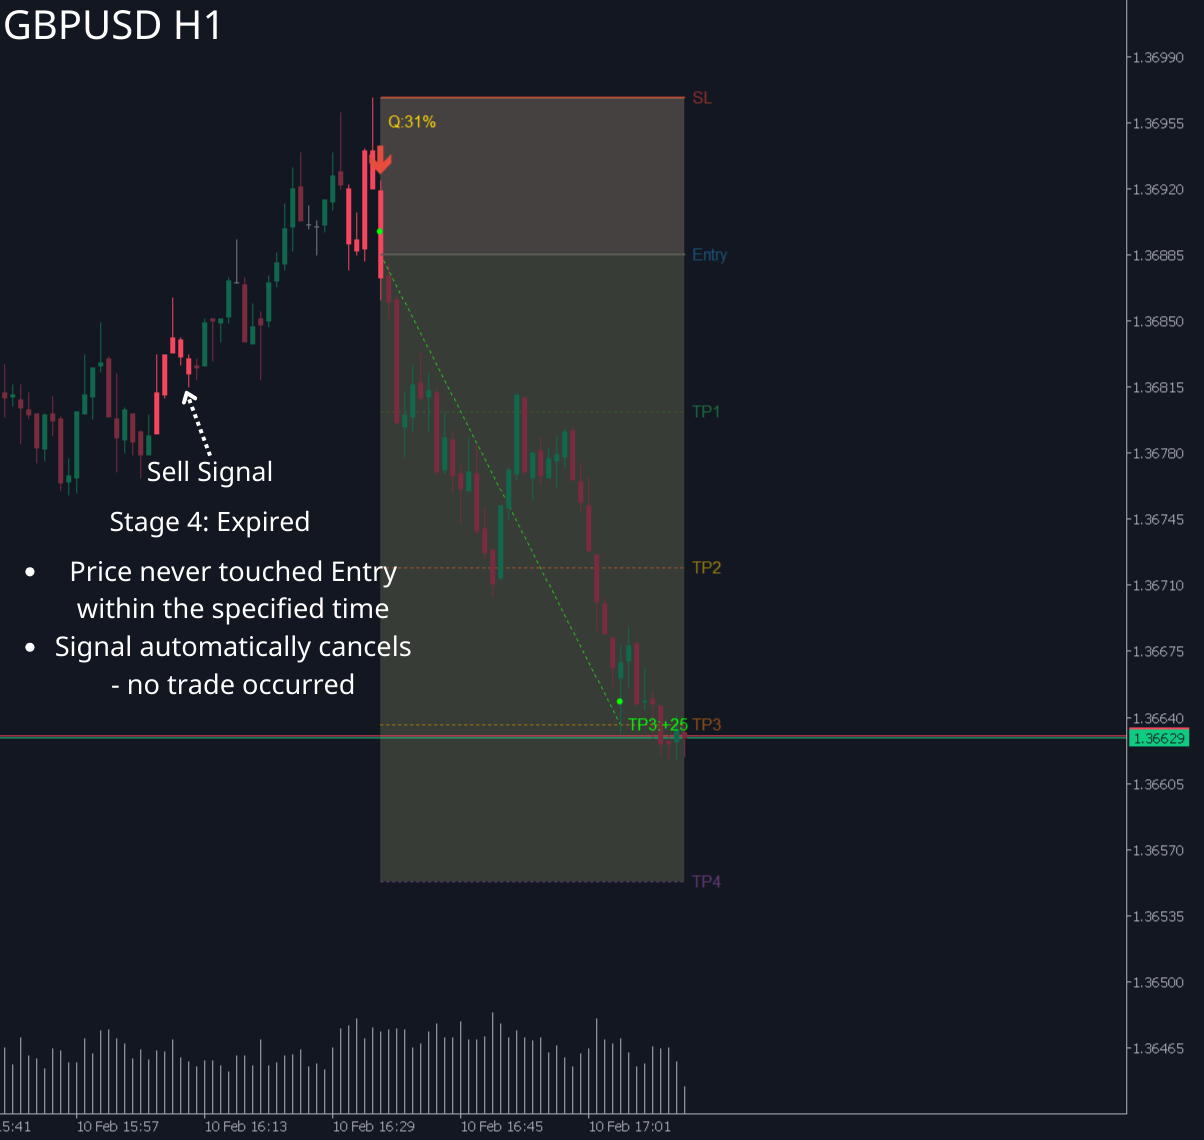
Stage 4: Expired
-
Price never touched Entry within the specified time
-
Signal automatically cancels - no trade occurred
-
3. Automatic Result Tracking
This is the most important feature - the product automatically tracks price and records results for you.
3.1. What Does the Product Do?
-
Tracks each new candle: checks if price touched Entry, TP1-TP4, or SL
-
Detects price gaps: if price "jumps" past a level (e.g., opens above TP1), the product still records it as touched
-
Scans history: when you attach the product to a chart, it scans past candles to determine results of historical signals
3.2. Important Rule: TP Takes Priority Over SL
Real-world example:
-
Same candle, price touched both TP2 (level 2050) and SL (level 2045)
-
Result: recorded as WIN at TP2
-
Reason: in reality, you would have taken profit at TP2 first. SL only counts when no TP has been touched
Simply put:
-
If price touched TP1, then later touched SL, it still counts as a win
-
SL only counts as a loss when price touches SL before all TPs
3.3. Review History Immediately When Activated
When you attach the product to a chart or switch timeframes:
-
Product scans backward through old candles
-
Automatically determines results of past signals
-
Immediately displays completed lines with correct results
Tip: You can scroll the chart back in time to see how past signals performed - like viewing a visual "trade history" on the chart.
4. Result Lines (Lines Connecting Entry to TP/SL)
After a signal has a result, the product draws a connecting line to show you the price journey clearly:
4.1. If Win (Price Touched TP)
A green line is drawn from Entry level to the touched TP level, with different colors depending on the level:
-
Touched TP1: light green
-
Touched TP2: green
-
Touched TP3: dark green
-
Touched TP4: gold (highest profit!)
4.2. If Loss (Price Touched SL)
A red line is drawn from Entry level to SL level
4.3. Circular Markers
At the candle where price touched TP or SL, the product places a circular marker so you know exactly which candle determined the result.
Tip: Observe result lines to learn - see how far price typically runs after a signal before reversing.
5. Profit/Loss Color Zones
The product lightly shades areas on the chart so you can see at a glance where profit and loss zones are:
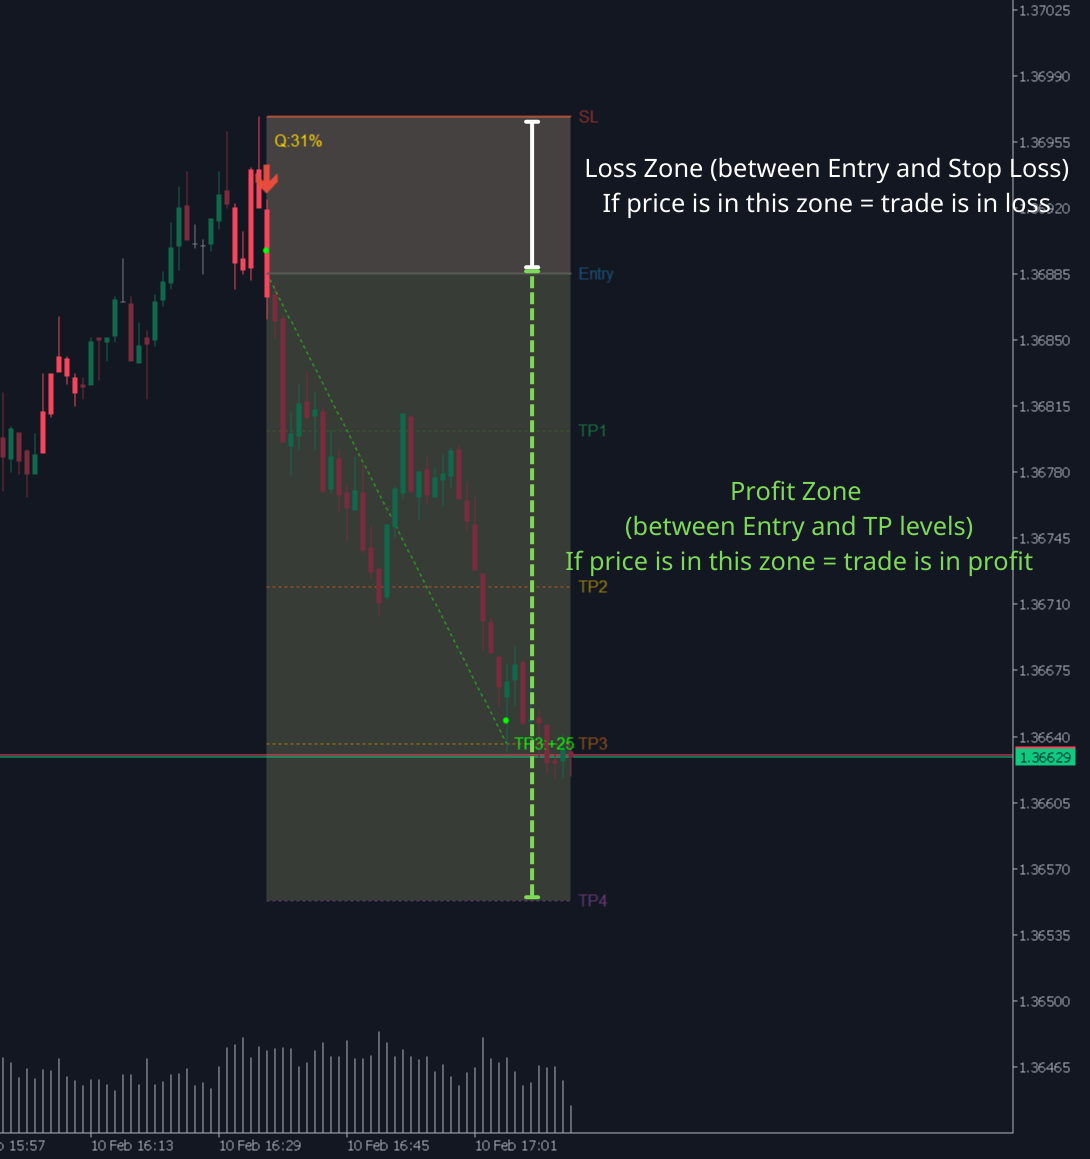
Loss Zone (between Entry and Stop Loss)
-
Shaded dark gray
-
If price is in this zone = trade is in loss
Profit Zone (between Entry and TP levels)
-
Shaded light gray
-
If price is in this zone = trade is in profit
Quick Risk:Reward Visual Check
-
If profit zone is much larger than loss zone = signal worth taking
-
If profit zone is smaller than loss zone = consider skipping
Tip: A good signal should have a profit zone at least 1.5 times the size of the loss zone.

When the product detects a trading opportunity, it draws horizontal lines on the chart to show you exactly:
-
Where to enter (Entry)
-
Where to place stop loss (Stop Loss)
-
Where to take profit (Take Profit 1, 2, 3, 4)
At the same time, the product automatically tracks whether price touches these levels, records win/loss results, and displays statistics directly on the chart.
1. Lines on the Chart
1.1. Each Line Has Its Own Color for Easy Recognition
When a new signal appears, you'll see horizontal lines on the chart:
| Line | Color | What does it mean? |
|---|---|---|
| Entry | Blue | Price level to enter Buy or Sell |
| Stop Loss | Red | Stop loss level - if price touches here, you lose |
| TP1 | Green | First take profit level (closest) |
| TP2 | Yellow | Second take profit level |
| TP3 | Orange | Third take profit level |
| TP4 | Purple | Fourth take profit level (farthest, highest profit) |
| Completed | Gray | Signal is finished (touched TP or SL) |
3. Additionally, you'll see arrows on the chart:
-
Green arrow = BUY signal
-
Red arrow = SELL signal
Tip: Choose signals with R:R ratio of 1.5 or higher. This means each win earns you more than each loss, so even with a 50% win rate, you'll still be profitable.
2. Signal Stages
Each signal on the chart goes through the following stages:
Stage 1: Awaiting Confirmation
-
Signal just appeared, lines are extending on the chart
-
You can review and prepare to enter
-
Stage 2: Running
-
Price has touched the Entry level - signal is activated
-
The product now tracks whether price will touch TP (win) or SL (loss)
Stage 3: Result Available
-
Price has touched TP or SL
-
Lines turn gray - you know immediately the signal has ended
-
Result (win/loss, how many pips) is recorded in statistics
Stage 4: Expired
-
Price never touched Entry within the specified time
-
Signal automatically cancels - no trade occurred
-
3. Automatic Result Tracking
This is the most important feature - the product automatically tracks price and records results for you.
3.1. What Does the Product Do?
-
Tracks each new candle: checks if price touched Entry, TP1-TP4, or SL
-
Detects price gaps: if price "jumps" past a level (e.g., opens above TP1), the product still records it as touched
-
Scans history: when you attach the product to a chart, it scans past candles to determine results of historical signals
3.2. Important Rule: TP Takes Priority Over SL
Real-world example:
-
Same candle, price touched both TP2 (level 2050) and SL (level 2045)
-
Result: recorded as WIN at TP2
-
Reason: in reality, you would have taken profit at TP2 first. SL only counts when no TP has been touched
Simply put:
-
If price touched TP1, then later touched SL, it still counts as a win
-
SL only counts as a loss when price touches SL before all TPs
3.3. Review History Immediately When Activated
When you attach the product to a chart or switch timeframes:
-
Product scans backward through old candles
-
Automatically determines results of past signals
-
Immediately displays completed lines with correct results
Tip: You can scroll the chart back in time to see how past signals performed - like viewing a visual "trade history" on the chart.
4. Result Lines (Lines Connecting Entry to TP/SL)
After a signal has a result, the product draws a connecting line to show you the price journey clearly:
4.1. If Win (Price Touched TP)
A green line is drawn from Entry level to the touched TP level, with different colors depending on the level:
-
Touched TP1: light green
-
Touched TP2: green
-
Touched TP3: dark green
-
Touched TP4: gold (highest profit!)
4.2. If Loss (Price Touched SL)
A red line is drawn from Entry level to SL level
4.3. Circular Markers
At the candle where price touched TP or SL, the product places a circular marker so you know exactly which candle determined the result.
Tip: Observe result lines to learn - see how far price typically runs after a signal before reversing.
5. Profit/Loss Color Zones
The product lightly shades areas on the chart so you can see at a glance where profit and loss zones are:
Loss Zone (between Entry and Stop Loss)
-
Shaded dark gray
-
If price is in this zone = trade is in loss
Profit Zone (between Entry and TP levels)
-
Shaded light gray
-
If price is in this zone = trade is in profit
Quick Risk:Reward Visual Check
-
If profit zone is much larger than loss zone = signal worth taking
-
If profit zone is smaller than loss zone = consider skipping
Tip: A good signal should have a profit zone at least 1.5 times the size of the loss zone.


