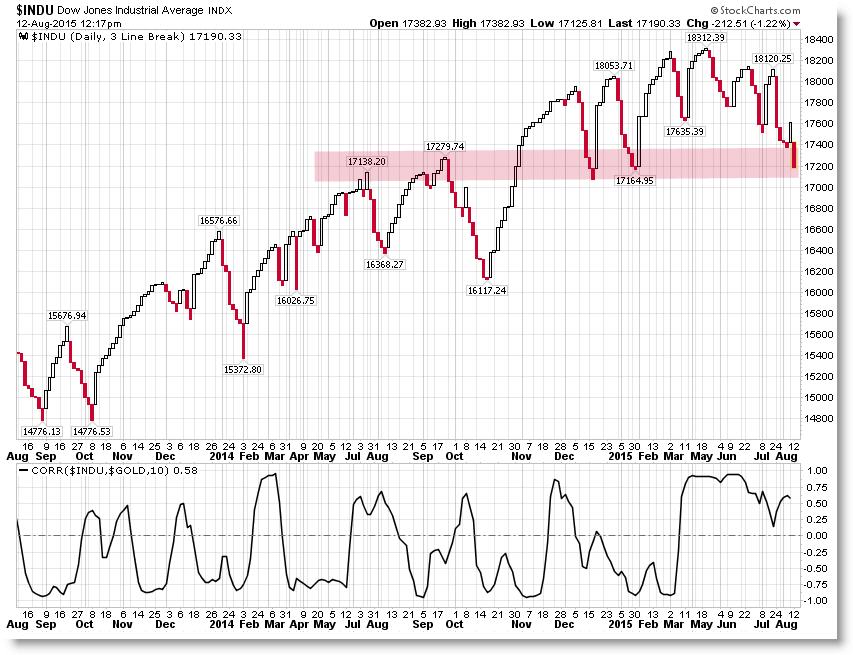
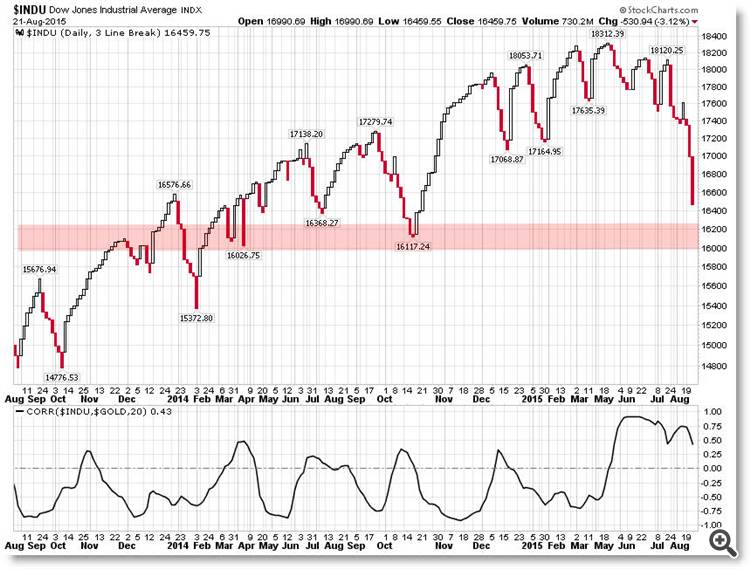
The first chart here is the Dow Jones chart. as we can see there the price line is testing now its previous support level around 17200. Below the chart I added the Correlation Index for the Dow Jones with Gold and as we can see the correlation begin to reverse its direction.

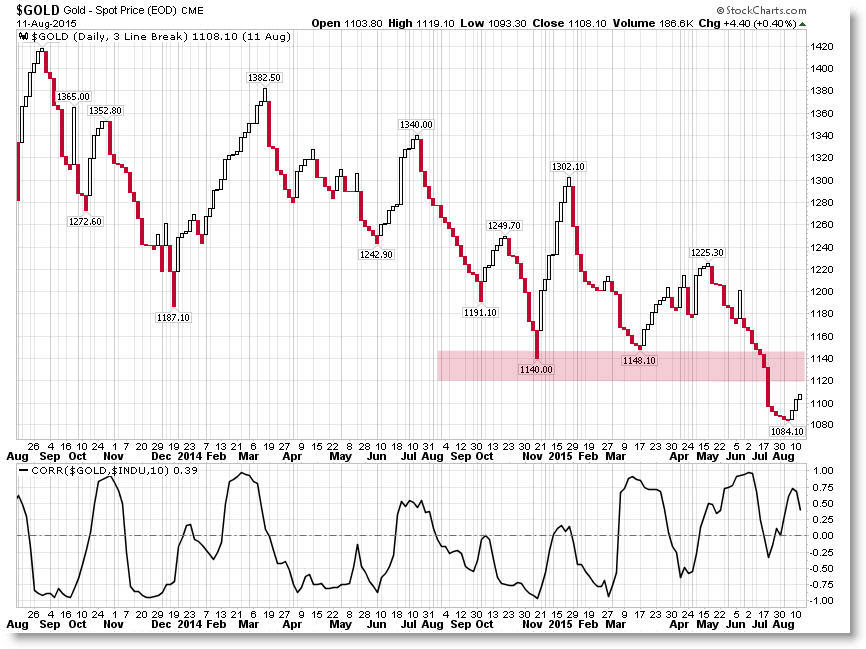
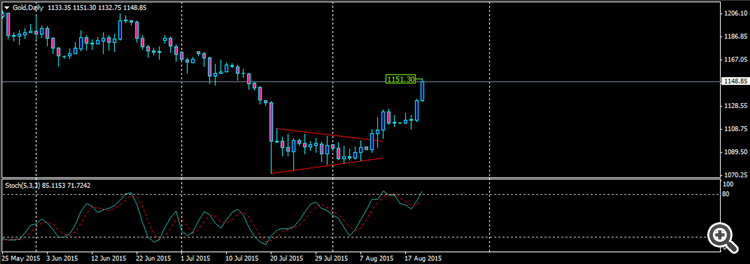
On the second chart we can see Gold and it seems to be less ready to rise back toward its resistance level around 1150$.

I think that in the near term if Gold found resistance around 1150$ the Dow Jones will find support around 17000 points as they have an inverted correlation most of the time.
Regards,
MB.


