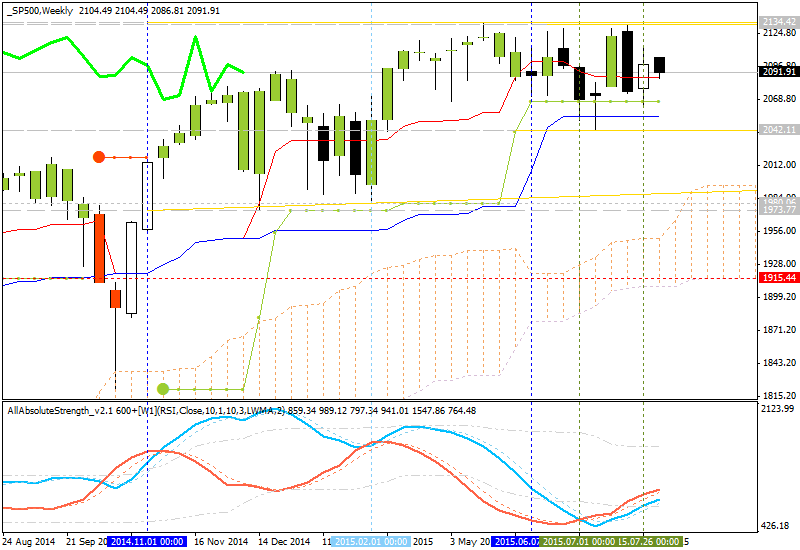
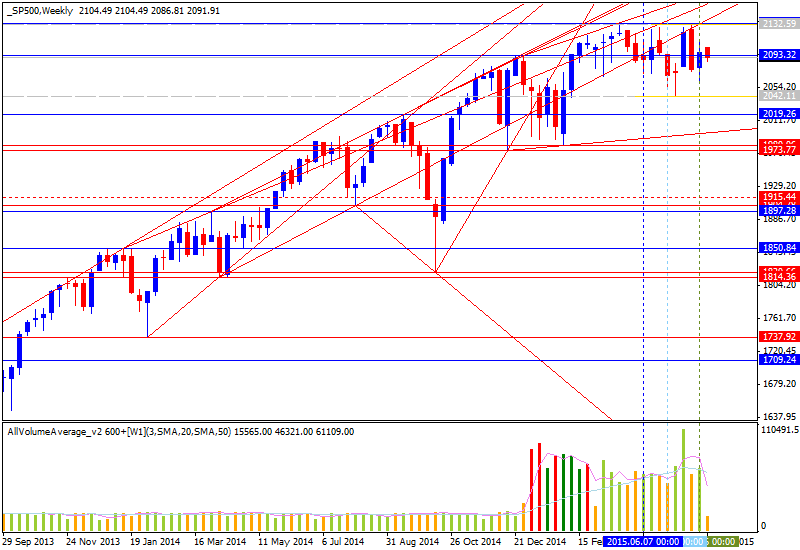
Weekly price is on bullish market condition for ranging between 2042.11 support level and 2134.42 resistance level:
- Chinkou Span line is indicating the ranging bullish.
- Next targets after 2134.42 resistance level to be broken is R1 Pivot at 2188.18.
- "A daily close below the 38.2% Fibonacci expansion at 2089.40 exposes the 50% level at 2081.20."
- "Alternatively, a reversal above the 23.6% Fib at 2099.50 clears the way for a challenge of the July 31 high at 2115.90."


If W1 price will break 2042.11
support level on close W1 bar so the secondary correction will be started up to yearly Central Pivot at 1963.05 as the next target.
If W1 price will break 2134.42 resistance level on close W1 bar so the bullish trend will be continuing up to 2188.18 next level.
If not so the price will be ranging between the levels.
Trend:


