

Sterling received a boost from the first estimate of UK Q2 GDP, which posted a positive 0.7% increase over the quarter, meeting forecasts.
London - Sterling hiked after the UK first Q2 GDP estimate showed that the UK economy grew 0.7% in the quarter to June, meeting forecasts.
The economy in Britain grew at a pace of 0.7% in the second quarter, an improvement from the 0.4% growth in the previous quarter.
Sterling added 0.24% gains to $1.5595, being lifted by positive GDP data, having traded in the red before the release.
"A good number here raises expectations about next week’s Bank of England rate meeting and the prospect of the first dissent on the interest rate consensus seen since the beginning of the year," Michael Hewson from CMC Markets UK wrote on Tuesday.
While the UK economy strides forward in its post-crisis recovery, the Bank of England is slowly but surely preparing households and markets for the time when monetary policy in Britain eventually turns toward more normal settings.
In the US, the Federal Reserve starts its two day policy meeting. A recent freefall in commodity prices spurred by the biggest daily fall on the Chinese stock markets since 2007, are likely to play a part in the US central banks thinking with respect to its policy stance, and with events in Greece by no means resolved, tomorrow’s decision is unlikely to offer any clues with respect to a September move.
Yesterday's mixed durable goods data for June did not provide any bolder support either. Today’s US consumer confidence numbers for July are expected to show a slight decline to 100 from 101.40.
Technical analysis
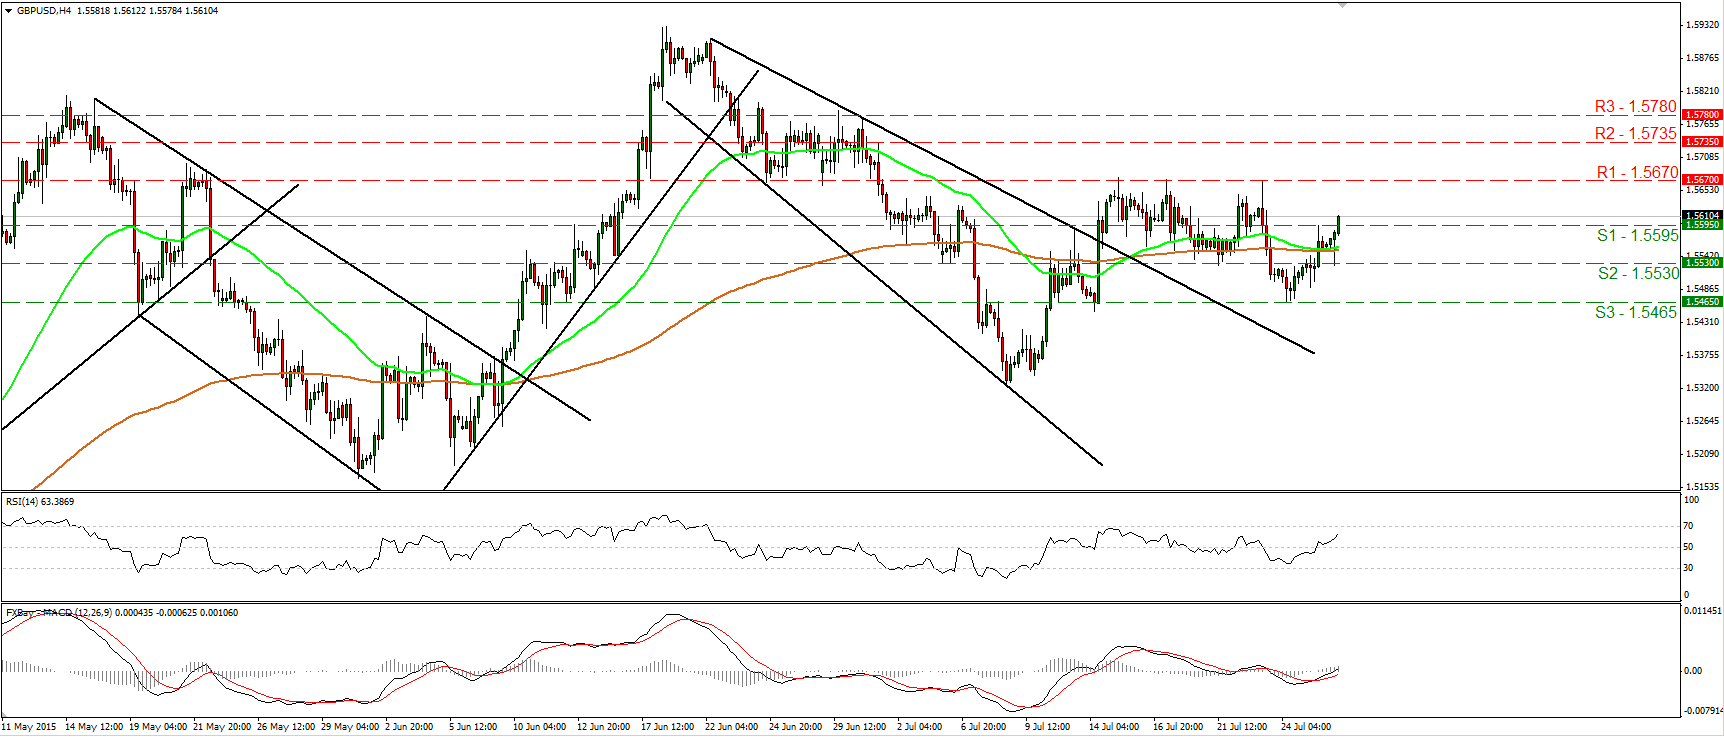
The daily chart looks choppy and since the beginning of June cable has not moved anywhere. The recent rally towards $1.59 was sold-off, but cable managed to hold the $1.55 barrier in previous days. The pair is also holding above the 200 and 100 daily moving averages, which is slightly bullish.
The stochastics oscillator indicates mildly oversold conditions, but there is no divergence between the price and the indicator. The MACD is hovering around zero and is therefore useless, while the momentum is slightly diverging with the price and is pointing for some possible bullish movement.
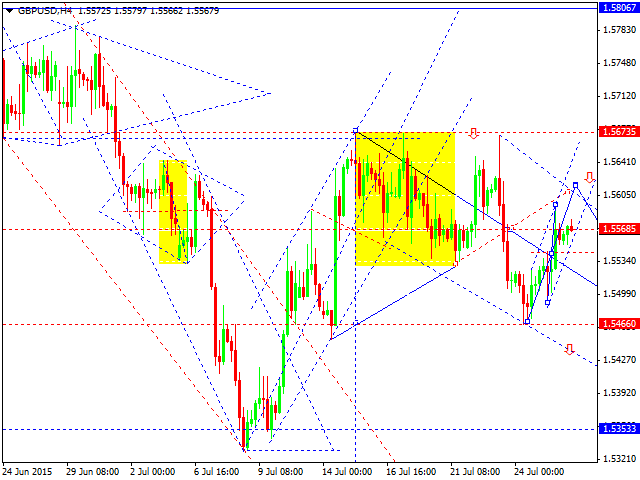
The four chart is limited by the bearish trend line since June highs, which is currently around $1.56. This marks the first important resistance for today's trading, followed by a series of triple-quadruple highs at $1.5660. On the other hand, the support line comes from July lows of $1.533 and $1.5480 and stands at $1.55. If cleared, $1.5460 will be in play very soon.
The momentum is somewhat neutral and points to choppy trading, while the MACD is about to cross to positive zone, which might be positive for sterling. The stochs is hovering below the overbought zone, with a possible leg higher, before being overbought.
The one hour chart is very ugly, currently testing the $1.5540 horizontal support area. The momentum, along with the MACD is starting to fade, with bears slowly taking control. The mentioned $1.55 zone is the key technical point for Tuesday's trading, dips should be bought here. The $1.5540 along with $1.55 are supports from the intraday point of view, while the resistance hovers at $1.56. Much be will be seen after the UK releases GDP for Q2 later in the session. The short term outlook is unclear as long as the pair remains stuck between $1.56 and $1.55, daily charts suggest a further upside is possible, when $1.56 will be cleared.


")
![[XAUUSD]: Weekly Liquidity Activation Points (timings), June 22-26, 2026](https://c.mql5.com/6/1013/splash-preview-771790.png "[XAUUSD]: Weekly Liquidity Activation Points (timings), June 22-26, 2026")
")