
NZDUSD Price Action Analysis - recovery after bullish Morning Star candlestick pattern
28 July 2015, 09:11

0
851
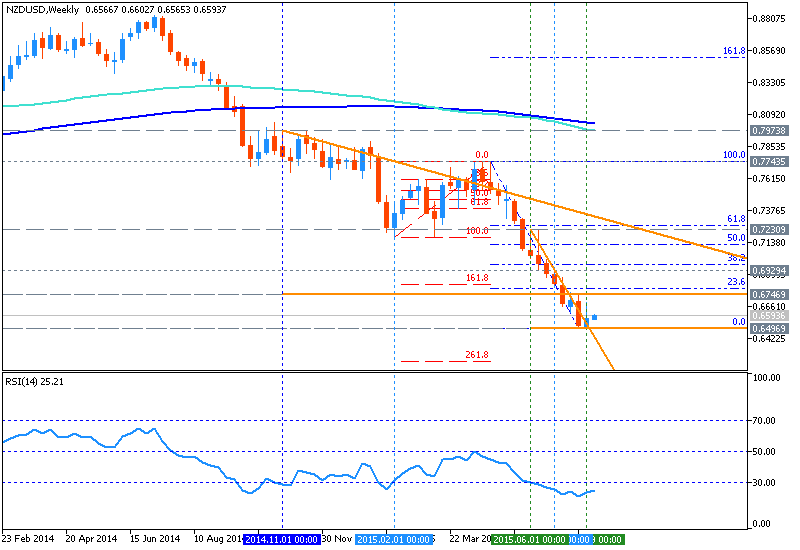
W1 price is located below 200 period SMA and 100 period SMA for the primary bearish market condition:
- The price is on downtrend for trying to break Fibo support level at 0.6496 for the bearish trend to be continuing;
- "The New Zealand Dollar is attempting a cautious recovery against its US namesake after putting in a bullish Morning Star candlestick pattern."
- If weekly price will break 0.6496 support
level so the primary bearish will be continuing, otherwise the price will be ranging within the familiar levels;
- “Near-term resistance is at 0.6679, the 14.6% Fibonacci retracement, with a break above that on a daily closing basis exposing the 23.6% level at 0.6791.”
Levels:
| Resistance | Support |
|---|---|
| 0.6679 | 0.6496 |
| 0.6791 | 0.6400 |


")
![[XAUUSD]: Weekly Liquidity Activation Points (timings), June 22-26, 2026](https://c.mql5.com/6/1013/splash-preview-771790.png "[XAUUSD]: Weekly Liquidity Activation Points (timings), June 22-26, 2026")
")