
GBPUSD Price Action Analysis - ranging near 200-SMA and 100-SMA for possible reversal
27 July 2015, 21:11

0
1 315
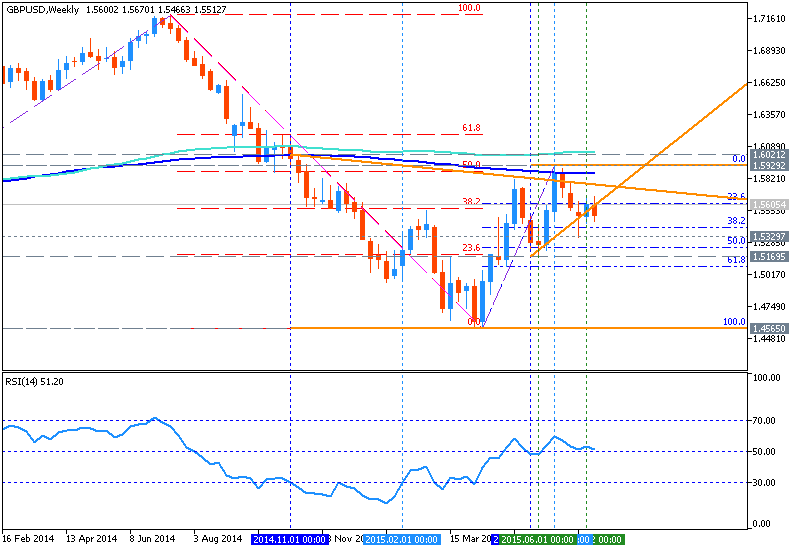
W1 price is located below and near 200 SMA and 100 SMA for the primary bearish: the price is ranging between 1.4565 support level and Fibo resistance level at 1.5929:
- 1.4565 support level is located below 200/100 SMA which are located far below this level;
- Fibo resistance level at 1.5929 is located between 100 SMA and 200 SMA in ranging area of the chart;
- If weekly price will break 1.4565
support
level on close weekly bar so the primary bearish trend will be
continuing; if the price will break Fibo resistance level at 1.5929 with the next target so we may see the reversal of the price movement to the primary bullish with the secondary ranging; otherwise price will be
ranging within familiar levels;
- “GBPUSD has broken above its 52 week average for the first time since September 2013. There are hurdles to clear from slope resistance (on various time frames) up to about 1.60. As such, a period of consolidation below 1.60 may be in store before an attempt on 1.64+ (2 equal legs from the April low).”
Trend:
- W1 - ranging bearish
- MN1 - ranging bearish


")
![[XAUUSD]: Weekly Liquidity Activation Points (timings), June 22-26, 2026](https://c.mql5.com/6/1013/splash-preview-771790.png "[XAUUSD]: Weekly Liquidity Activation Points (timings), June 22-26, 2026")
")