
Technical Analysis for US DOLLAR, S&P 500, GOLD and CRUDE OIL - S&P 500 Attempting to Break Out of Two-Week Down Trend

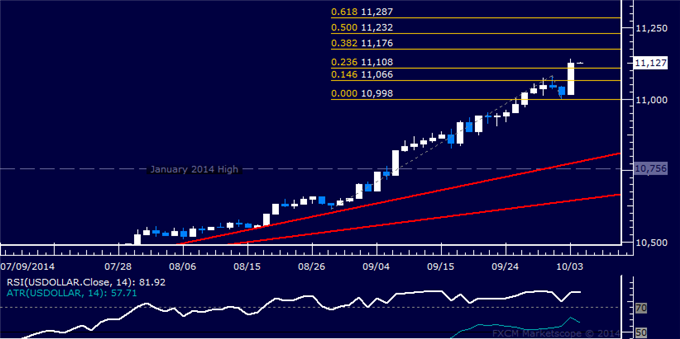
Prices issued the largest daily gain in 16 months, rising to the strongest level since June 2010. Near-term resistance is at 11176, the 38.2% Fibonacci expansion, with a break above that on a daily closing basis exposing the 50% threshold at 11232. Alternatively, a turn below the 23.6% Fib at 11108 opens the door for a challenge of the 14.6% threshold at 11108.
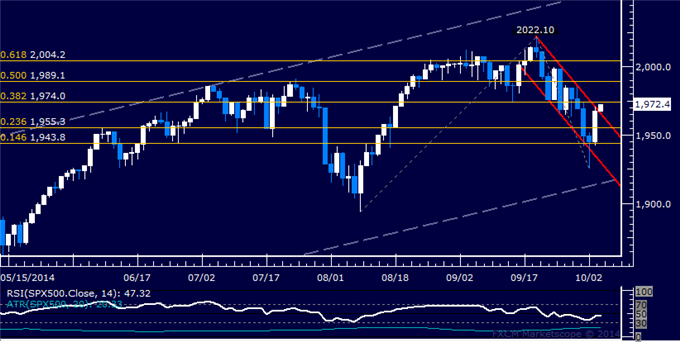
S&P 500 TECHNICAL ANALYSIS
Prices are testing above falling
channel resistance (1965.10) to challenge the 38.2% Fibonacci expansion
at 1974.00. A break above this barrier on a daily closing basis exposes
the 50% level at 1989.10. Alternatively, a reversal below the 23.6% Fib
at 1955.30 targets the 14.6% expansion at 1943.80.
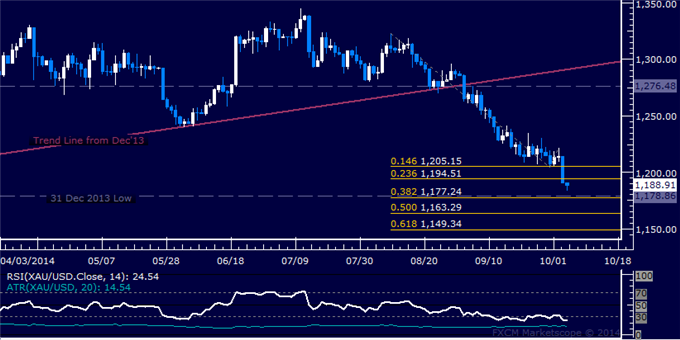
GOLD TECHNICAL ANALYSIS
Prices dropped to the lowest level in
10 months, with traders now aiming to challenge the 1177.24-78.86 zone
marked by the December 2013 low and the 38.2% Fibonacci expansion. A
break below this boundary exposes the 50% level at 1163.29.
Alternatively, a reversal above the 23.6% Fib at 1194.51 targets the
14.6% expansion at 1205.15.
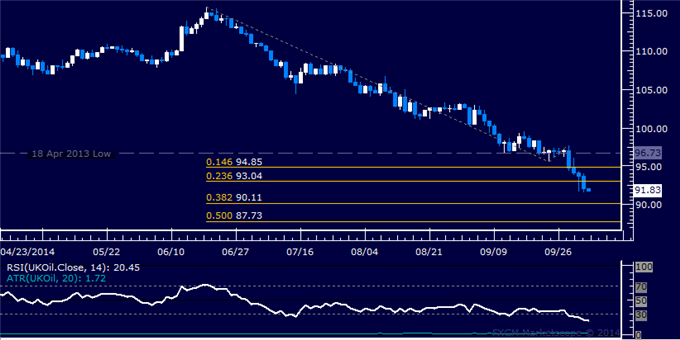
CRUDE OIL TECHNICAL ANALYSIS
Prices are aiming to challenge
support at 90.11, the 38.2% Fibonacci expansion. A break below that
exposes the 50% level at 87.73. Alternatively, a reversal above the
23.6% Fib at 93.04 aims for the 14.6% expansion at 94.85.


")

")