This Chart Shows How Complex the U.S. Stock Market Has Become
This Chart Shows How Complex the U.S. Stock Market Has Become
Stock market fragmentation has a silver lining
In recent years, the U.S. stock market has changed dramatically, thanks to an influx of regulatory, technological, and competitive pressures. The increasing complexity of the market has often been blamed for the technological glitches that appear to be occurring with some frequency on the country's stock exchanges.
On Wednesday, the New York Stock Exchange halted trading for three and a half hours to fix a computer malfunction. While NYSE is one of the biggest U.S. stock-trading venues, it is still just one of 11 exchanges and more than 50 private venues where American equities change hands. As Bloomberg News reported, while today’s issue affected transactions on NYSE's main market, and indexes derived from prices generated by that venue, investors could still buy and sell stock elsewhere.
In other words, all that stock market complexity has a silver lining. If one trading venue goes down, there will (hopefully) be plenty of alternatives still working.
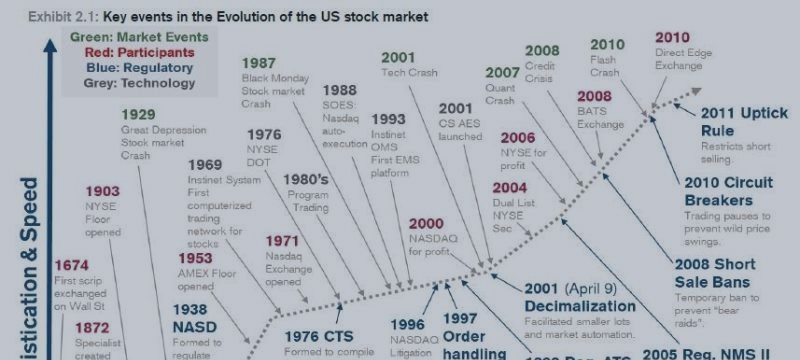
Here's a chart, published by Credit Suisse in 2013, illustrating the rising complexity of America's stock markets. The red dates show the advent of new stock trading venues, while blue indicates technological milestones and gray new regulation.
(Not shown is the U.S. Securities and Exchange Commission's recent effort to "strengthen the technology infrastructure" of the country's stock market.)
https://www.mql5.com/en/signals/111434


