
NZD/USD - weekly breakdown with bearish condition
3 July 2015, 03:11
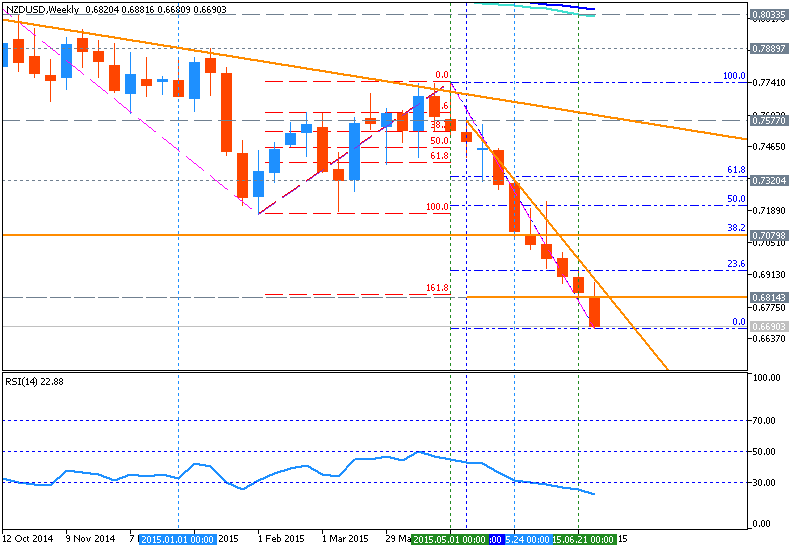
- "NZD/USD broke below the
March-April advance at .6800 on Tuesday to trade at its lowest level in
over 5-years"
- Weekly price is below 100-period SMA and 200-period SMA for bearish breakdown
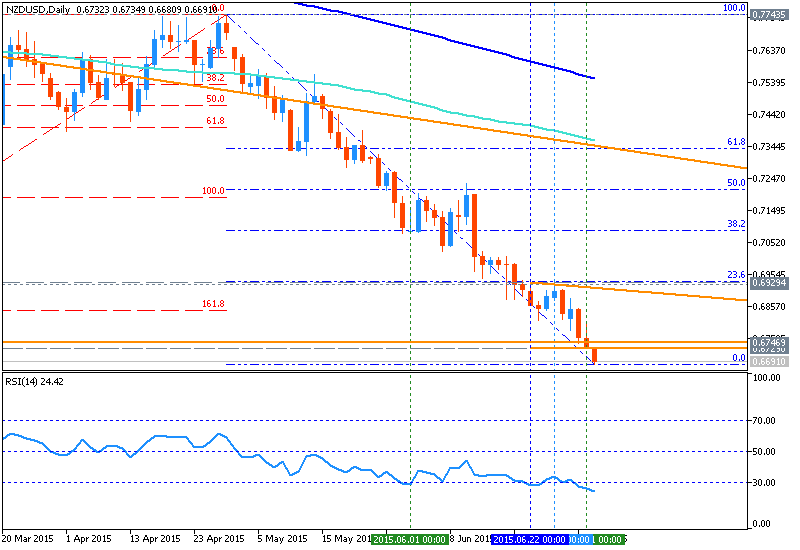
- Daily price is below 100-day SMA and 200-day SMA for bearish market condition
- Weekly price is breaking Fibo key support at 0.6693 for the breakdown to be continuing
- RSI indicator is estimating the breakdown with oversold condition
- "A daily close back above .6955 would turn us positive on the kiw"
NZDUSD Strategy
| Instrument | Support 2 | Support 1 | Spot | Resistance 1 | Resistance 2 |
|---|
| NZD/USD |
.6700 |
.6750 |
.6770 |
.6800 |
.6955 |


")
