
Technical Analysis: Gold Up And S&P Down? Gold looks oversold while the S&P looks too high

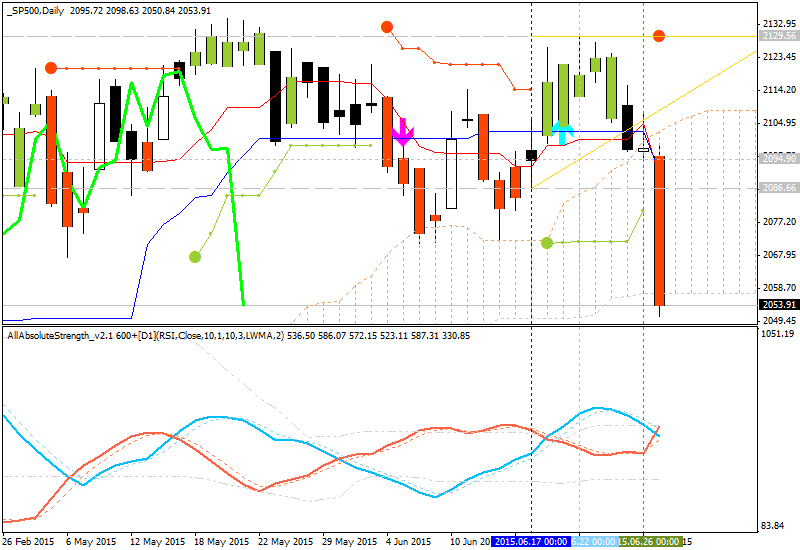
Daily shart is showing the reversal: the price broke Senkou Span A line which is the virtual border between the primary bullish and the primary bearish on the chart - price came tio inside Ichimoku cloud with the secondary ranging. If 2057 support is broken so we can see about S&P 500 Index to be in totally bearish condition.
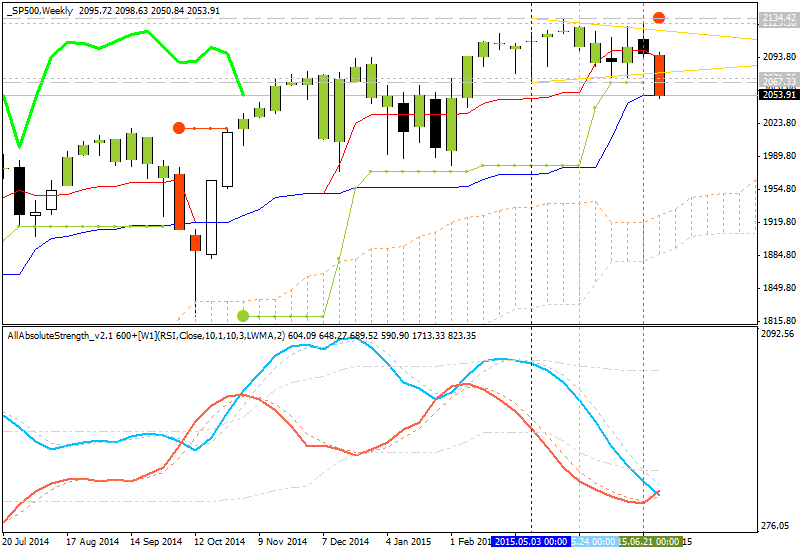
About W1 timeframe, as we can see - this is secondary correction just started within the primary bullish.
Consider this 25 year graph of the ratio of gold to S&P 500 Index. Unless you believe, AS I DON’T, that the Fed can levitate the S&P for many more years while squashing gold even further, this 25 year chart shows that gold is currently very low compared to the S&P.
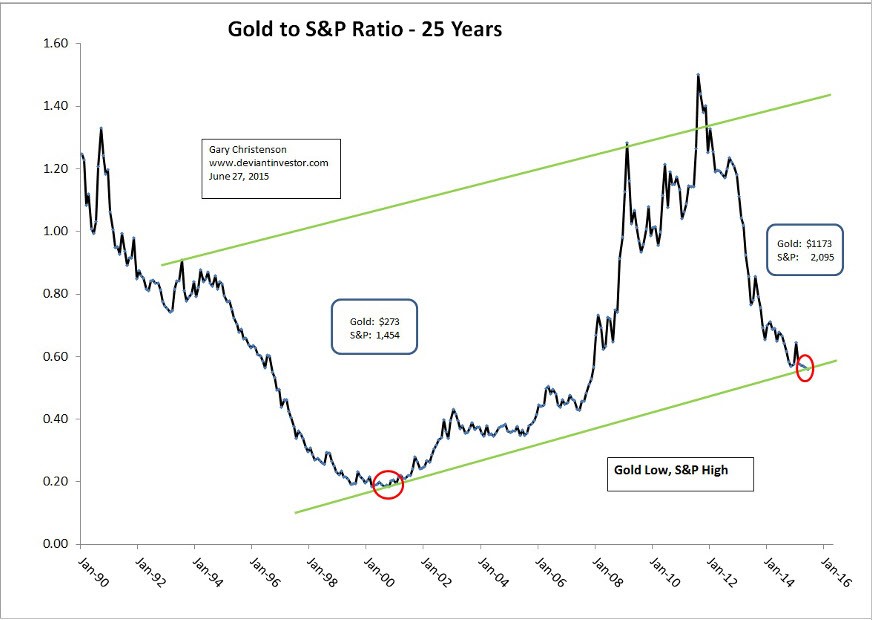
The S&P 500 Index is about 100 points (June 26, 2015) above its 65 week moving average, as shown by the blue moving average line on the graph. The Disparity Index (deviation from the 65 week moving average) shows that the S&P has been strong since 2012. The upward trend line will be broken with a decisive fall below about 2,080, which seems likely to occur soon.
- Gold has been weak for over three years.
- The S&P 500 has been strong for over three years and appears to be at a 7 to 8 year cyclic peak.
- The ratio of gold to the S&P is at a 7.5 year low and sitting on the bottom of a trend channel.
- Gold looks oversold while the S&P looks too high and dangerously over-extended. A correction substantially below 2,080 would break the uptrend line and a break below about 2015 would penetrate the 65 week moving average.


")
![[XAUUSD]: Weekly Liquidity Activation Points (timings), June 22-26, 2026](https://c.mql5.com/6/1013/splash-preview-771790.png "[XAUUSD]: Weekly Liquidity Activation Points (timings), June 22-26, 2026")
")