

Consumer Price Index (CPI) is the change in the price of goods and services purchased by consumers. We will have this high impacted news event on Monday, August 19 so this smallarticle is related about how to use and to trade this CPI.
The CPI measures the changes in retail prices for goods and services. In the US, it is considered the number one indicator for inflation, and it is one of the main economic reports the Fed uses when determining when to change interest rates.
The consumer price index measures a weighted basket of about 200 commonly purchased goods and services. Each month, the BLS determines the retail prices for these items and compares them to the prices from the previous month to gauge the change in the average cost of living. The data is then grouped into 2 separate indexes.
CPI (W) category is for for wage earners, and clerical workers.
The CPI (U) is for all Urban workers.
The data most economists pay attention to, the main statistics reported in the media, and the information used in this video come from the CPI(U) report.
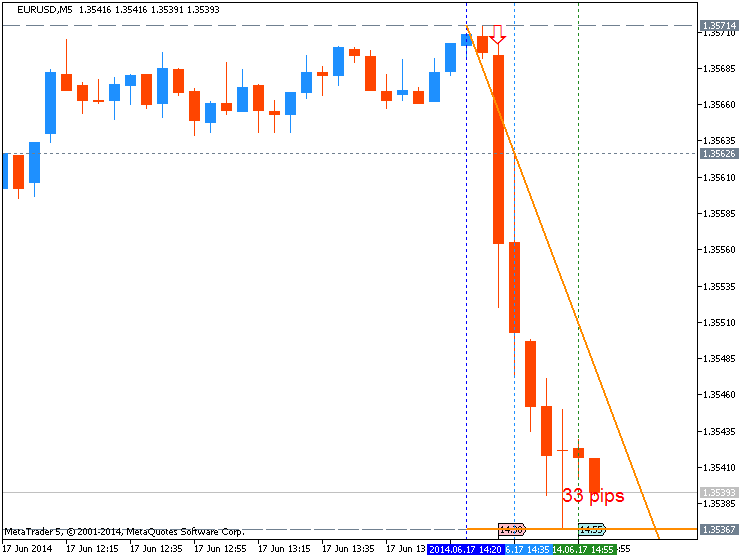
EURUSD M5 : 33 pips price movement by USD - CPI news event:
CPI (W) report for wage earners category, covers about 1/3 of the working population, and is used for things like cost of living adjustments in social security payments.
For each category, an index number is provided that is an ongoing, continuous percent of change in prices from an original start date. For the main categories, this date is 1982 to 1984. In other words, every month they compare prices to what the average prices were in 1982 to 1984, and then add to, or subtract from, the total percentage of change since then.
So again, they add up the prices in the basket of goods, compare it to the prices from 1982 to 1984, generate an index number, and then compare it to the previous index number.
They take the difference between these two numbers, and then divide it by the previous month index number.
The CPI report is issued monthly about 3 weeks after the month being reported.
The report contains one main table, A, and several follow up tables. There are also several short summaries of the data for table A that contain the most important statistics.
The two main statistics reported in the media are the seasonally adjusted percent change for the total index from the previous month, and the non-seasonally adjusted 12 month percent change of the total index.
The first is the one month total change in prices for goods and services throughout the country, adjusted for seasonal factors such as weather conditions. This is the seasonally adjusted inflation rate for one month.
The second is the total change in prices for goods and services for an entire year. This change is not adjusted for seasonal factors, so it more accurately reflects the total change of prices consumers pay. In other words, this is the total inflation rate for a whole year.
In addition, perhaps equally important, is the seasonally adjusted rate of change for all items less food and energy. In this section, items relating to food and energy are removed. Because of the volatility of prices of items in these two categories, some economists feel that by removing these items, one gets a more accurate view of inflation. This category is often referred to as Core CPI.
As I mentioned before, there are several follow up tables at the end of the report. The first table is the change of prices for the entire basket of goods broken down into detail which shows the change of price for individual sections, sectors and commodities.
The 2nd table is the same thing, only the prices and index numbers have been seasonally adjusted.
The third table is the change of prices broken down by different areas.


