

Value of Ichimoku
Transitioning to Short-Term Thinking
An Example with GBPUSD
Many traders favor finding trends at some level of the chart. The trend may be within an overall range, but these traders know if they can catch an intermediate trend, that one move can make their day, week, or month if they catch it right. Thankfully, Ichimoku can help you limit risk while capturing upside.
Value of Ichimoku
Ichimoku is a trend following indicator that in and of itself can comprise an entire trading system. The value of Ichimoku is the visual display of different forms of support in an uptrend or resistance in a downtrend. Regardless of your bias or approach, the cloud is a helpful tool to easily spot the path of least resistance in the market.
Learn Forex: Ichimoku Example
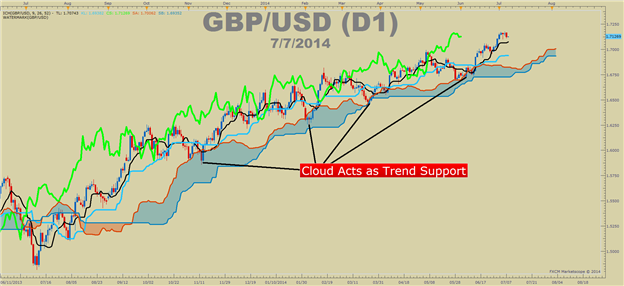
Each component of Ichimoku is helpful. However as you start to focus on
shorter time frames two components become more critical. Those two
components are the Cloud & the Momentum line.
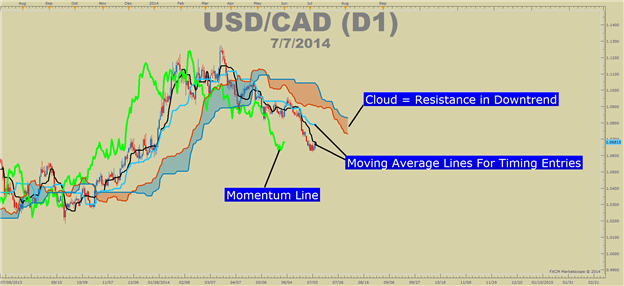
Learn Forex: Ichimoku Diagram
Transitioning to Short-Term Thinking
To focus on short-term trading requires an eye for a few specific
things. First, you need to know that trade management will make or break
your trading and unmanaged stops and limits may leave you disappointed
in the overall end result.
Second, you’re effectively trading momentum. Once momentum expires, so
does your interest in the trade. Lastly, you’re best riding in the
direction of the intra-day trend which can be defined by price riding
the cloud.
An Example with GBPUSD
Based on what you just read, as a short-term trader, you’re focused on
short-term trends and their corresponding momentum. If you want to take
this within the scope of potential longer-term tops and bottoms you’re
welcome to but of course, the idea here is to limit risk significantly
by getting out of a trade when the intra-day trend reverses.
For those interested in the potential of a GBPUSD reversal and the
potential resistance points on the major pair, here are a few things to
look at followed by a short-term Ichimoku chart for you to focus on:
GBPUSD has been recently trading within a historically pivotal area
around 1.7130-1.7180 but has failed to sustain a rally through there.
Last week’s high was exactly 1.7180 with no follow through seen since
then. The overall long-term set-up is similar to 1998, a time period
that we have extensively referred to with regard to the USD-Index. Also,
sentiment has reached extremes on multiple sentiment indicators.
Short-term dynamics are also pointing to a correction within the
uptrend.
Applying the short-term scope of Ichimoku to GBPUSD would have us focusing on taking a short short-term trade as long as two things are in play:
- Price stays below the cloud
- Lagging line, and thus momentum, also stays below the cloud
Learn Forex: Short-Term Set-Up If GBPUSD Breaks Below 1.7100
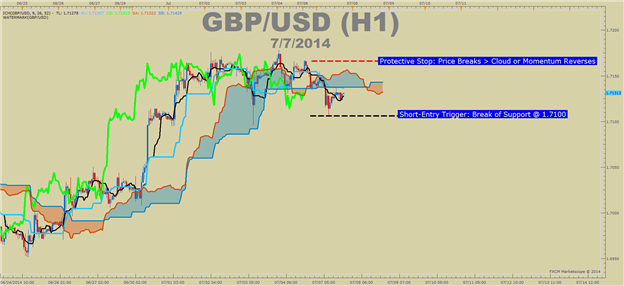
When momentum reverses, as seen by the lagging line reversing from the
cloud, you can exit the trade knowing that either a reversal is at play
or a correction. If a correction is at play and you stay in the trade,
you run the risk of foregoing a better opportunity by binding up your
margin in a non-active trade.


")

")