Required indicator: Full Stochastic
Instrument: Any
Time Frame: Any
The Idea of the Strategy
The strategy uses Full Stochastic indicator to detect price reversals.
Input Settings
The settings for input parameters can be any three consequent Fibonacci numbers. Fibonacci numbers are: 1, 2, 3, 5, 8, 13, 21, 34, 55, 89, 144, 233, 377, 610, 987, ...
In this example I will use 34, 55 and 89, which are also the default parameter values for the Full Stochastic indicator. So, the settings are:
- K_Period = 89
- Slow_K+Period = 55
- D_Period = 34
The Tactics
The basic tactic is to wait for all of the three lines (%K, Slow K and %D) to go out of the 20-80 range. Then, when Slow K and %D crossover each other (out of the 20-80 range), if %K line goes back and crosses level 50, and at the same time the price on main chart moves in the desired direction, the position should be opened. The movement of price is measured between the close of candle (1) in which the crossing of Slow K and %D had occurred, and the close of the candle(2) in which %K had crossed level 50.
Stop loss should be placed on the worst price level of the worst candle between the close of candles 1 and 2. The worst price insures that the SL is the safest logically possible.
Position should be closed when Slow K and %K lines go to the opposite end, and crossover each other out of the 20-80 range.
Valid Signal Example
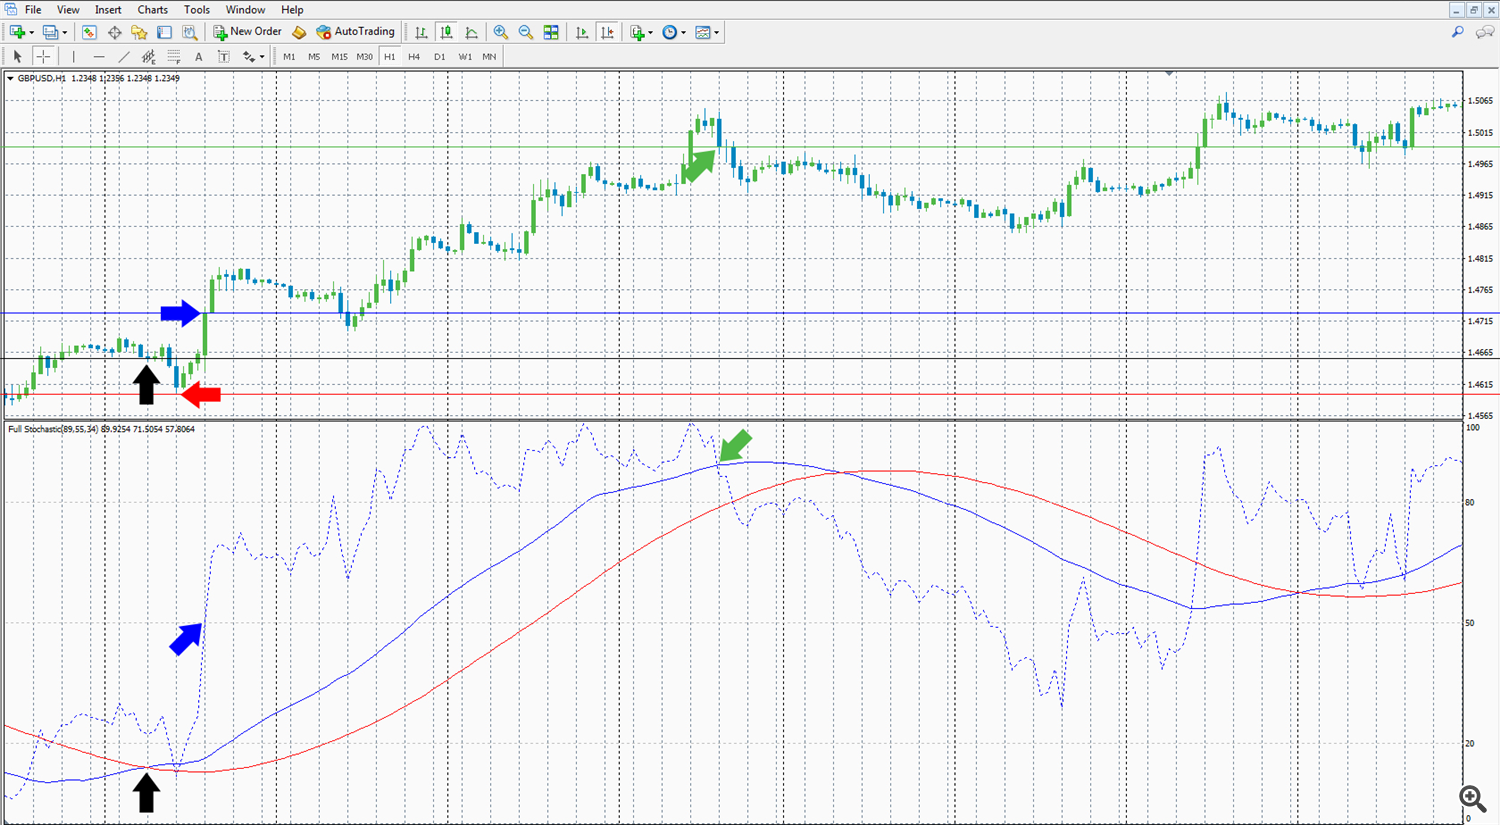
Example of good signal can be seen on first screenshot.
Black arrows are showing Slow K and %D crossing point and the candle in which the crossing had occurred. Black line shows the close price of the crossing candle. Because the crossing is below level 20, it is a BUY signal. Blue arrows are showing %K crossing level 50 and the candle in which that crossing had occurred. Blue line shows the close price of the %K crossing level 50 candle. Because it is a BUY signal, we check if the price had moved up between black and blue lines, and it had, so it is a confirmation that the BUY signal is valid, so we open BUY position at the close price of blue arrow candle. Now we are looking at the candles between black and blue arrow: we search for the most far candle from the desired direction. Because it is a BUY signal, we look for the candle with the lowest low. Red arrow is showing the candle with the lowest low, and that low will be our Stop Loss. The red line is showing Stop Loss. At last, because it is a BUY order we wait the Slow K and %K to go over level 80 and crossover there, and that is when we close our position.
False Signal Example
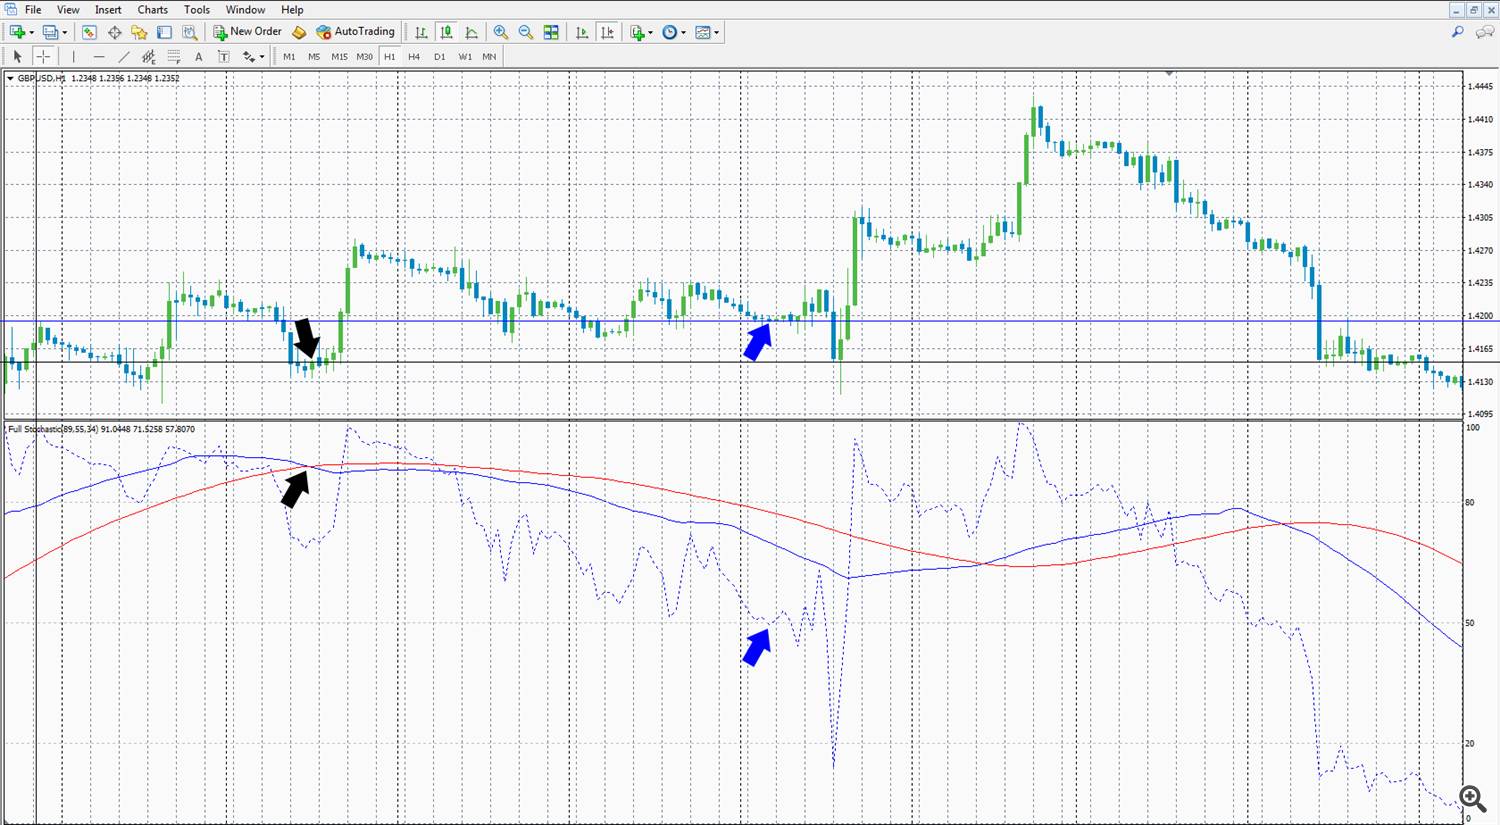
On the second screenshot we see a different situation: a false signal.
Simply put - the signal is not valid because the price at the blue arrow is worse than the price at the black arrow. Slow K and %D had crossed above the 80 level, so it is a SELL signal, but the price at the moment %K is crossing the level 50 is higher than the price when SELL signal occurred, so we do not open SELL position. The price action is not in our favor so we pass this signal.
Note
Above strategy is just an basic example, there are a lot more things to consider, and the best practice is to check for even more confirmations and pick only the very best trades. Always use a common sense while trading, trading is a risky business. As with all indicators, there is a margin for errors. Not all signals are valid.


