
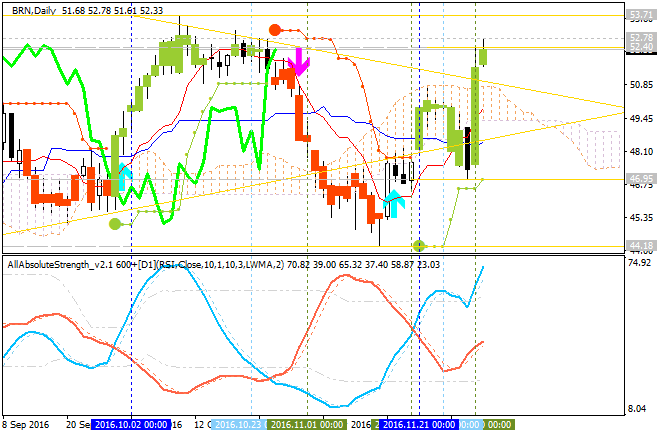
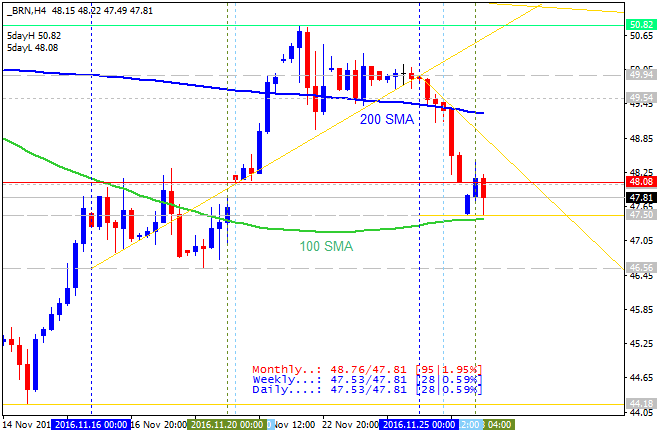
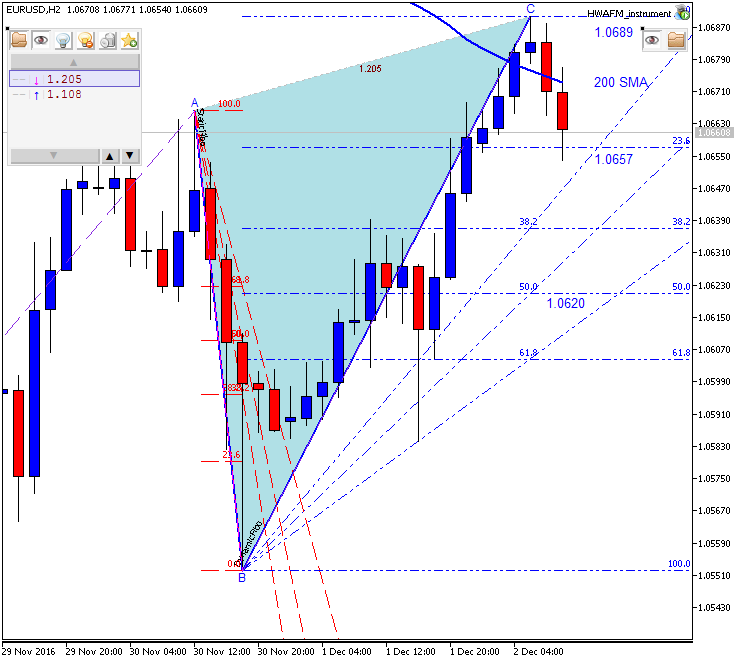
Quick Technical Overview - Brent Crude Oil: intra-day ranging; daily bullish breakout to be started
1 December 2016, 11:18

9
449
The intra-day price is located abobe 200 SMA/100 SMA for the bullish market condition: the price is trying to break 52.63 resistance level for the bullish trend to be continuing.
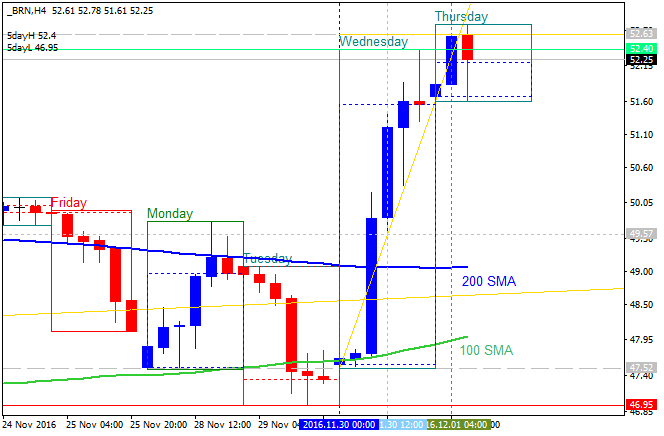
- If the price breaks 52.63 resistance level on close H4 bar so the bullish trend will be continuing.
- If price breaks 52.40 support on close H4 bar to below so the secondary ranging within the primary bullish trend will be started for the intra-day price movement during the some very short period of time.
- If not so the price will be ranging within the levels.
| Resistance | Support |
|---|---|
| 52.63 | 52.40 |
| 53.71 | 49.57 |
| N/A | 46.95 |


")
![[XAUUSD]: Weekly Liquidity Activation Points (timings), June 22-26, 2026](https://c.mql5.com/6/1013/splash-preview-771790.png "[XAUUSD]: Weekly Liquidity Activation Points (timings), June 22-26, 2026")
