

Oscillators give traders an idea of how momentum is developing on a
specific currency pair. When price treks higher, oscillators will move
higher. When price drops lower, oscillators will move lower. Whenever
oscillators reach an extreme level, it might be time to look for price
to turn back around to the mean. However, just because an oscillator
reaches “Overbought” or “Oversold” levels doesn’t mean we should try to
call a top or a bottom. Oscillators can stay at extreme levels for a
long time, so we need to wait for a valid sign before trading.
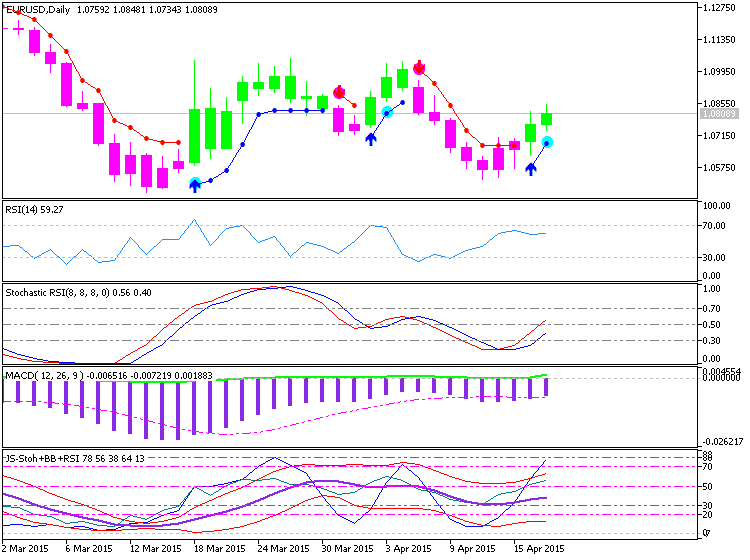
RSI
The Relative Strength Index is arguably the most popular oscillator out there. A big component of its formula is the ratio between the average gain and average loss over the last 14 periods. The RSI is bound between 0 – 100 and is considered overbought above 70 and oversold when below 30. Traders generally look to sell when 70 is crossed from above and look to buy when 30 is crossed from below.
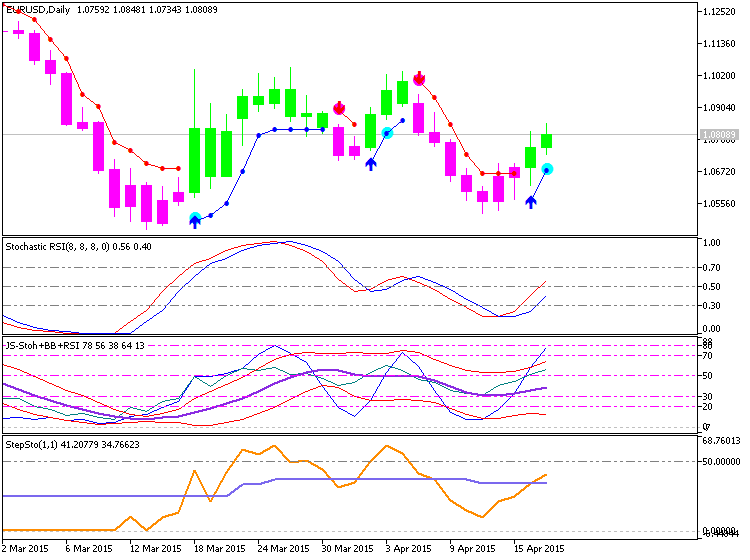
Stochastics
Stochastics offer traders a different approach to calculate price oscillations by tracking how far the current price is from the lowest low of the last X number of periods. This distance is then divided by the difference between the high and low price during the same number of periods. The line created, %K, is then used to create a moving average, %D, that is placed directly on top of the %K. The result is two lines moving between 0-100 with overbought and oversold levels at 80 and 20. Traders can wait for the two lines to crosses while in overbought or oversold territories or they can look for divergence between the stochastic and the actual price before placing a trade.
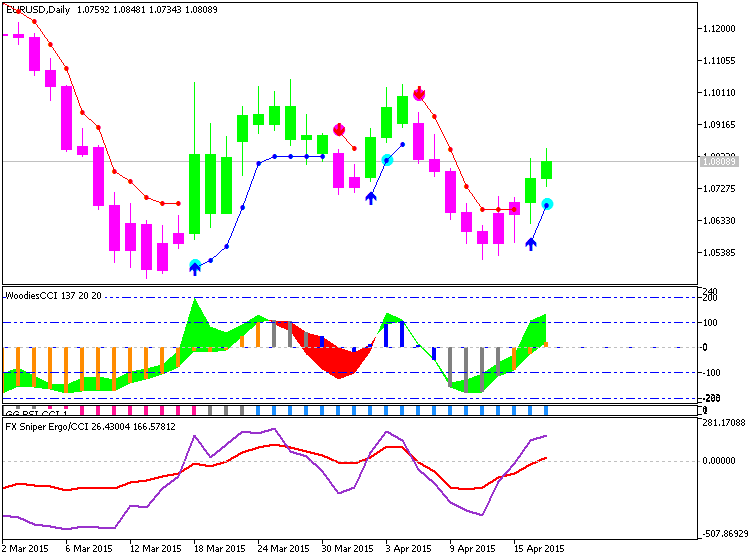
CCI
The Commodity Channel Index is different than many oscillators in that there is no limit to how high or how low it can go. It uses 0 as a centerline with overbought and oversold levels starting at +100 and -100. Traders look to sell breaks below +100 and buy breaks above -100. To see some real examples of the CCI in action,
MACD
RSI
The Relative Strength Index is arguably the most popular oscillator out there. A big component of its formula is the ratio between the average gain and average loss over the last 14 periods. The RSI is bound between 0 – 100 and is considered overbought above 70 and oversold when below 30. Traders generally look to sell when 70 is crossed from above and look to buy when 30 is crossed from below.
Stochastics
Stochastics offer traders a different approach to calculate price oscillations by tracking how far the current price is from the lowest low of the last X number of periods. This distance is then divided by the difference between the high and low price during the same number of periods. The line created, %K, is then used to create a moving average, %D, that is placed directly on top of the %K. The result is two lines moving between 0-100 with overbought and oversold levels at 80 and 20. Traders can wait for the two lines to crosses while in overbought or oversold territories or they can look for divergence between the stochastic and the actual price before placing a trade.
CCI
The Commodity Channel Index is different than many oscillators in that there is no limit to how high or how low it can go. It uses 0 as a centerline with overbought and oversold levels starting at +100 and -100. Traders look to sell breaks below +100 and buy breaks above -100. To see some real examples of the CCI in action,
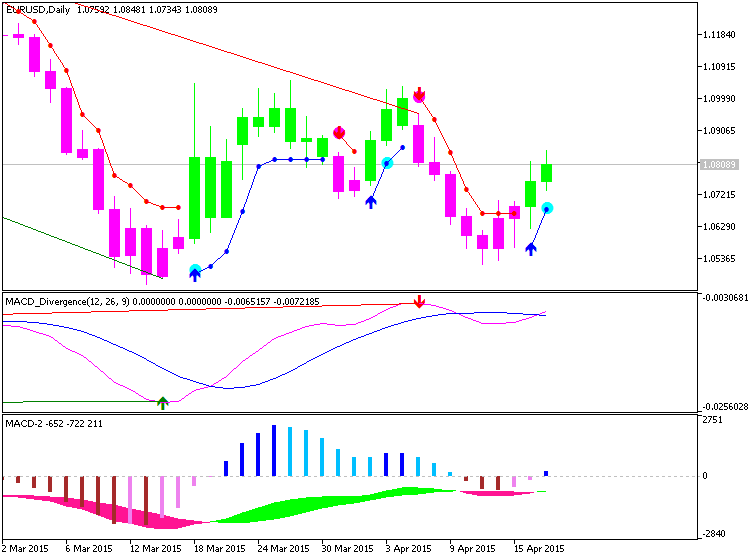
MACD
The Moving Average Convergence/Divergence tracks the difference between two EMA lines, the 12 EMA and 26 EMA. The difference between the two EMAs is then drawn on a sub-chart (called the MACD line) with a 9 EMA drawn directly on top of it (called the Signal line). Traders then look to buy when the MACD line crosses above the signal line and look to sell when the MACD line crosses below the signal line. There are also opportunities to trade divergence between the MACD and price.


")
 Trading Guide")
