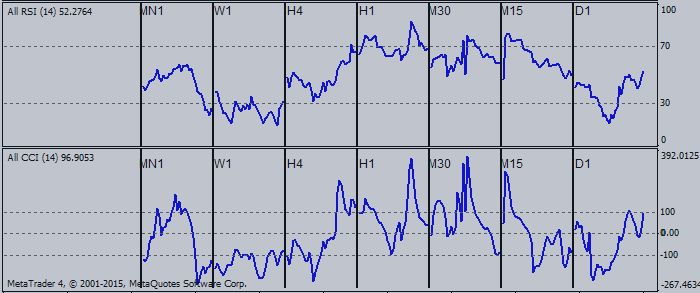
- When the CCI is high it shows that price is unusually high compared to the average price.
- When the CCI is low it shows that price is unusually low compared to the average price.
- When the CCI is high it shows that price is unusually high compared to the average price.
- When the CCI is low it shows that price is unusually low compared to the average price.

The CCI typically oscillates between ±100.
- CCI values above +100 indicate an overbought conditions and an impending price correction.
- CCI values below -100 indicate an oversold conditions and an impending price correction
Buy:
- If the CCI is oversold, levels below -100, then there is a pending price correction.
- The oversold levels will remain intact until CCI starts to move above -100.
- When price starts moving above -100 then that is a buy signal.
- The CCI buy signal should be combined with a price trend line break to confirm the signal.

Sell:
- If the CCI is overbought, levels above +100, then there is a pending price correction.
- The overbought levels will remain intact until CCI starts to move below +100.
- When price starts moving below +100 then that is a sell signal.
- The CCI sell signal should be combined with a price trend line break to confirm the signal.

Bullish Divergence: Bullish Divergence is formed when price is making new lows while the CCI is failing to surpass its previous low. This is a bullish signal because the divergence will be followed by an upward price correction.

Bearish Divergence is formed when price is making new highs while the CCI is failing to surpass its previous high. This is a bearish signal because the divergence will be followed by a downward price correction.


