
How To Trade - RSI Indicator for Overbought/Oversold Levels and How Does It Work
10 May 2015, 06:11

0
2 798
The Relative Strength Index
(RSI) was created by J. Welles Wilder Jr. and introduced in his book,
"New Concepts in Technical Trading Systems," published in 1978. Wilder
was a mechanical engineer and real estate investor before going into
market research and trading. He spent most of his life in Greensboro,
N.C., before moving to New Zealand.
RSI is one of several popular technical indicators developed by Wilder, including Parabolic SAR, Average True Range (ATR) and the Average Directional Movement Index (ADX). Still widely used, these classic indicators are often included by default in charting and technical analysis software.
RSI is not to be confused with relative strength, which compares a security's performance to that of an overall market average or index such as the Dow Jones Industrial Average.
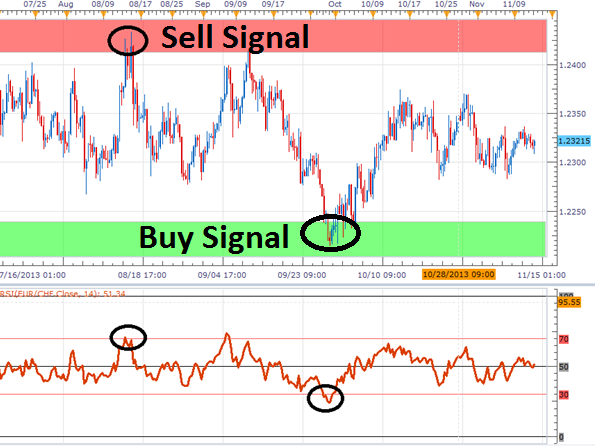
The most basic RSI application is to use it to identify areas that are potentially overbought or oversold. Movements above 70 are interpreted as indicating overbought conditions; conversely, movements under 30 reflect oversold conditions. The level of 50 represents neutral market momentum and corresponds with the center line in other oscillators such as MACD.


")
![[XAUUSD]: Weekly Liquidity Activation Points (timings), June 22-26, 2026](https://c.mql5.com/6/1013/splash-preview-771790.png "[XAUUSD]: Weekly Liquidity Activation Points (timings), June 22-26, 2026")
")