

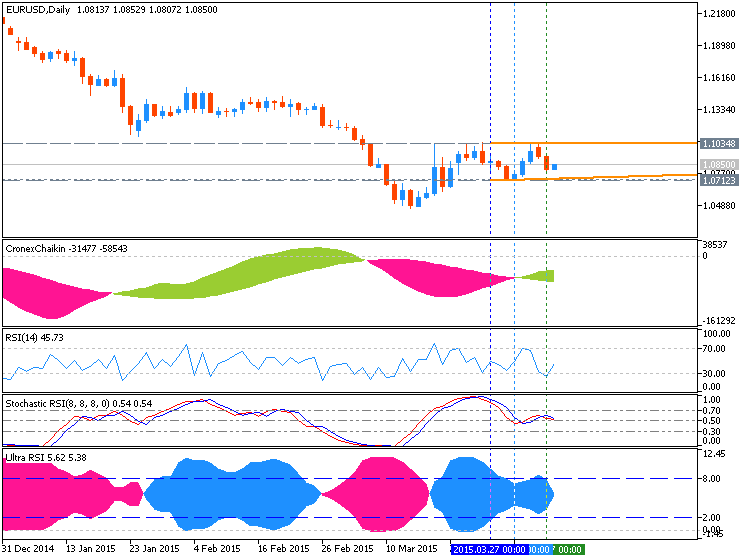
Relative Strength Index (RSI) is
most popular indicator. RSI is an oscillator which is oscillating between 0 and 100. The RSI is indicates the strength of trend:
- values above 50 indicate a bullish trend
- values below 50 indicate bearish Forex trend.
The RSI measures momentum of currency.
- The centerline for the RSI is 50, crossover of the centerline indicate shifts from bullish to bearish and vice versa.
- Above 50, the buyers have greater momentum than the sellers and price of a currency will keep going up as long as RSI stays above 50.
- Below 50, the sellers have greater momentum than the buyers and price of a currency will keep going downwards as long as RSI stays below 50.
The RSI uses 14 day period as the default RSI period, this is the period recommended by J Welles Wilders when he introduced the RSI. Other common periods used by forex trader is the 9 and 25 day moving average.
- When the RSI is below 50, the price kept moving in a downward trend. The price continues to move down as long as RSI was below 50. When the RSI moved above 50 it showed that the momentum had changed from sell to buy and that the downtrend had ended.
- When the RSI moved to above 50 the price started to move upwards and the trend changed from bearish to bullish. The price continued to move upwards and the RSI remained above 50 afterwards.


")
![[XAUUSD]: Weekly Liquidity Activation Points (timings), June 22-26, 2026](https://c.mql5.com/6/1013/splash-preview-771790.png "[XAUUSD]: Weekly Liquidity Activation Points (timings), June 22-26, 2026")
")