
Technical Price Pattern Analysis for US Dollar, S&P 500, Gold and Crude Oil

US DOLLAR TECHNICAL ANALYSIS
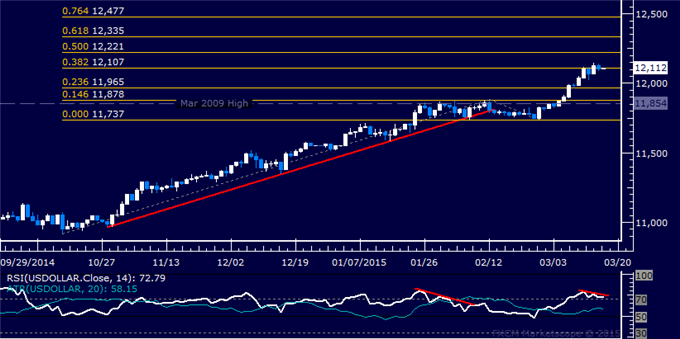
Prices may be readying to correct
lower as negative RSI divergence warns of fading bullish momentum.
Near-term resistance is at 12221, the 50% Fibonacci expansion, with a
break above that on a daily closing basis exposing the 61.8% level at
12335.
S&P 500 TECHNICAL ANALYSIS
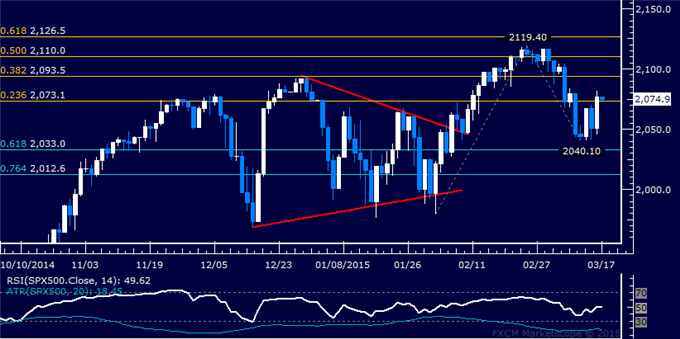
Prices broke upward, with buyers
now targeting the 38.2% Fibonacci retracement at 2093.50. A break above
that on a daily closing basis exposes the 50% level at 2110.00.
GOLD TECHNICAL ANALYSIS
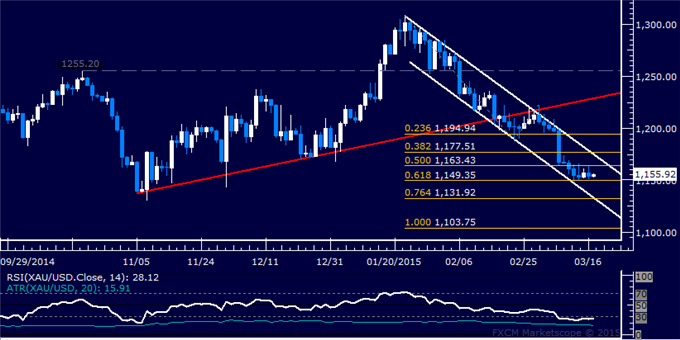
Prices are digesting losses after
dropping to a three-month low. A break above the 50% Fibonacci expansion
at 1163.43 on a daily closing basis exposes the 38.2% level at 1177.51.
Alternatively, a push below the 61.8% Fib at 1149.35 targets the 76.4%
expansion at 1131.92.
CRUDE OIL TECHNICAL ANALYSIS
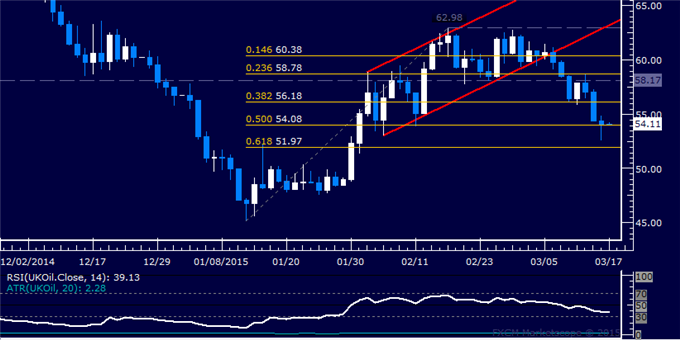
Prices resumed pushing lower,
sliding to the lowest level in six weeks. A daily close below the 50%
Fibonacci retracement at 54.08 exposes the 61.8% level at 51.97.
Alternatively, a reversal above the 38.2% Fib at 56.18 targets the
58.17-78 area marked by the 23.6% retracement and the February 6 close.


 & AMD Framework")