
Technical Analysis for USDCAD - Bearish Engulfing candlestick pattern with 38.2% Fibonacci retracement
16 February 2015, 18:11

0
517
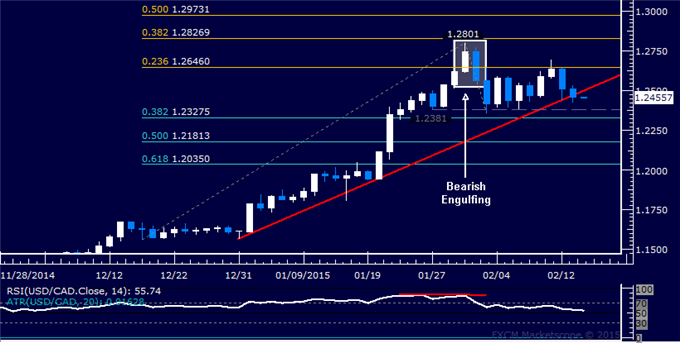
The US Dollar turned lower against its Canadian counterpart as expected
after putting in a Bearish Engulfing candlestick pattern.
Risk/reward considerations argue against entering short with prices in close proximity to support. On the other hand, the absence of a defined bullish reversal signal suggests taking up the long side is premature. We will remain flat for now, waiting for a more actionable opportunity to present itself.
Near-term support is in the 1.2328-81area, marked by the 38.2% Fibonacci retracement and the January 27 low, with a break below that on a daily closing basis exposing the 50% level at 1.2181. Alternatively, reversal above trend line support-turned-resistance at 1.2494 opens the door for a challenge of the 23.6% Fib expansion at 1.2646.
- USD/CAD Technical Strategy: Flat
- Support: 1.2328, 1.2181, 1.2035
- Resistance: 1.2494, 1.2646, 1.2827
Risk/reward considerations argue against entering short with prices in close proximity to support. On the other hand, the absence of a defined bullish reversal signal suggests taking up the long side is premature. We will remain flat for now, waiting for a more actionable opportunity to present itself.


")
![[XAUUSD]: Weekly Liquidity Activation Points (timings), June 22-26, 2026](https://c.mql5.com/6/1013/splash-preview-771790.png "[XAUUSD]: Weekly Liquidity Activation Points (timings), June 22-26, 2026")
")