

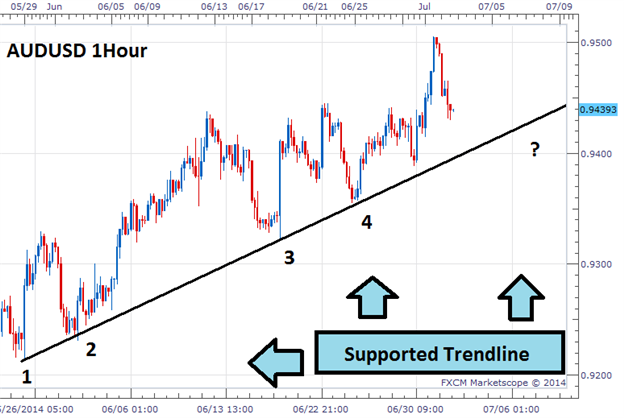
In an uptrend, trendlines develop by connecting a series of lows
Depending on the trend, trendlines will act as support or resistance
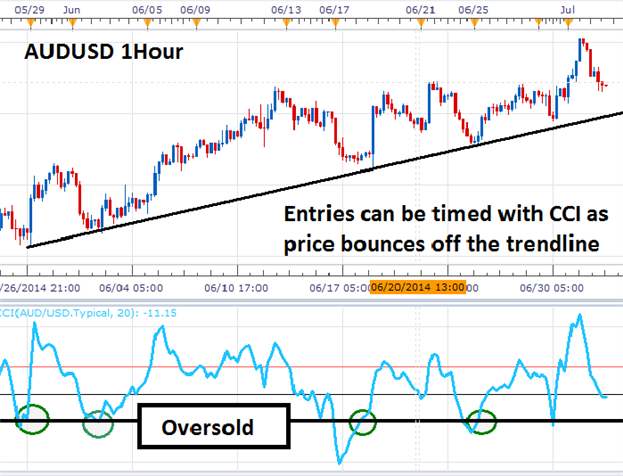
Traders can use an oscillator, like CCI, to time market entries
Drawing trendlines is an important skill for every Forex trader to master. These lines of support and resistance can be drawn on virtually any graph, regardless of the timeframe which makes them incredibly useful in trend based strategies. The key is to match up a series of higher lows in an uptrend and lower lows in a downtrend.
For today’s lesson, we will be look at a detailed example of drawing and trading trendlines with the AUDUSD.
Below is an excellent example of an active trendline on a AUDUSD 1 Hour chart. Since the price trend is headed up, the trendline is created by connecting a series of lows on the chart. The key to this process is to find the first two points and connect them together. From this point, simply extrapolate the trendline. Now you will have an ascending line of support to work with when you go to execute your trading strategy.
Once the trendline is drawn, traders will begin looking for areas to
enter new positions. One of the easiest solutions is to trade price as
it bounces off support. This process can be aided through the use of an
oscillator to time when momentum is returning in the direction of the
primary trend. Let’s take a look at an example.
Below, you can again see our trendline developing on the 1Hour AUDUSD graph. However, this time we have added the CCI (Commodity Channel Index) indicator. Traders will time their entries into the market when prices bounce off our trendline and CCI crosses back above an oversold value of -100. These dips in the market often happen after a breakout, and traders will be ready to place new buy orders in expectations of price making a new high.


")