
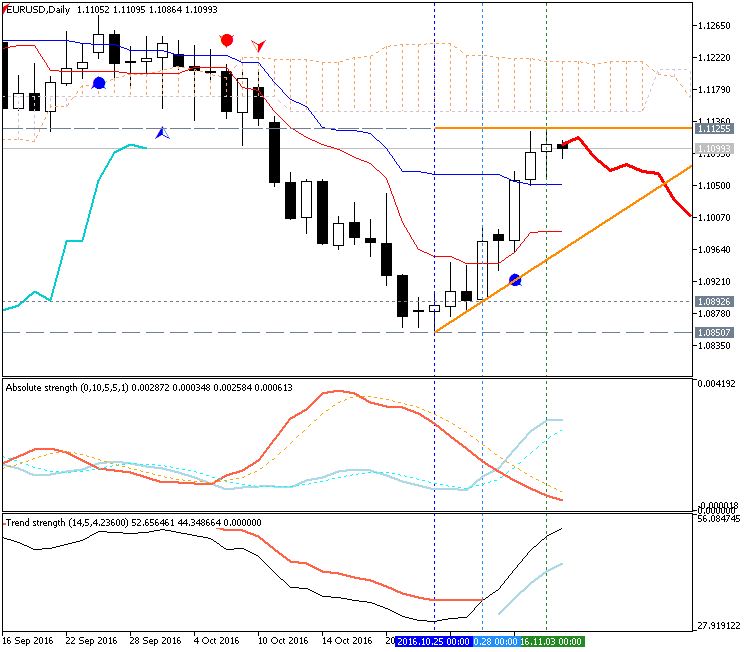
EURUSD Technical Analysis 2016, 30.10 - 06.11: bearish with ranging rally with 1.1038 resistance

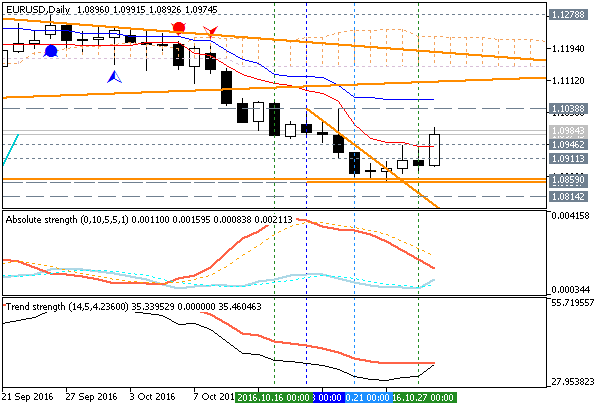
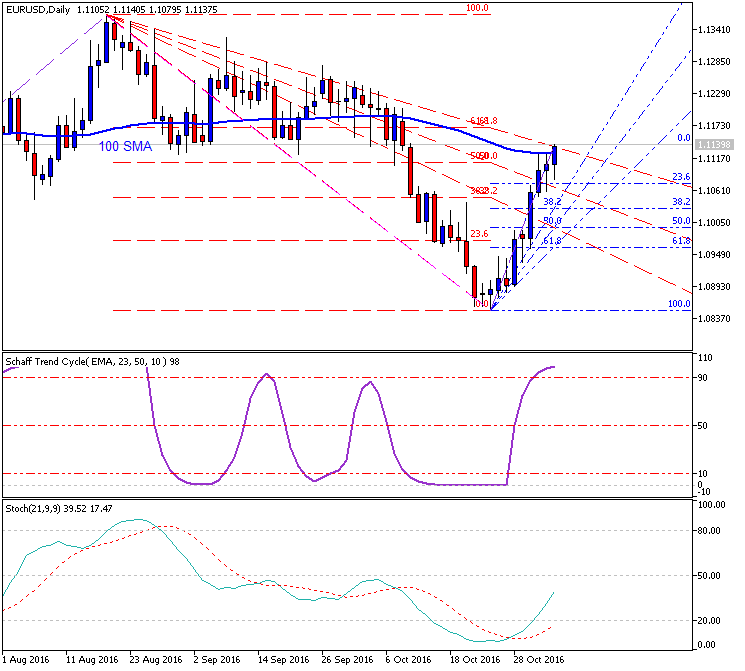
Daily price is on located below Ichimoku cloud in the bearish area of the chart. The price was started with the local uptrend as the secondary rally within the primary bearish market condition and with 1.1038 resistance level to be crossed to above for the bear market rally to be continuing.
By the way, the descending triangle pattern was formed by the price to be crossed to below for the bearish trend to be resumed, Trend Strength indicator is estimating the trend as the bearish, but Absolute Strength indicator together with Chinkou Span line of Ichimoku are evaluating the future trend as the bearish with ranging rally.
If D1 price breaks 1.0859 support level on close bar so the primary bearish trend will be resumed with 1.0814 bearish target.If D1 price breaks 1.1038 resistance level on close bar from below to above so the local uptrend as the bear market rally will be continuing.
If D1 price breaks 1.1278 resistance level on close bar from below to above so we may see the reversal of the daily price movement from the ranging bearish to the primary bullish market condition.
If not so the price will be on bearish ranging within the levels.
- Recommendation for long: watch close D1 price to break 1.1038 for close bar for possible buy trade
- Recommendation to go short: watch D1 price to break 1.0859 support level on close daily bar for possible sell trade
- Trading Summary: ranging rally
| Resistance | Support |
|---|---|
| 1.1038 | 1.0859 |
| 1.1278 | 1.0814 |
SUMMARY: bearish
TREND: bear market rally


 & AMD Framework")
