 Long-Term Technical Analysis: bear market rally with the possible bullish reversal")
Hang Seng Index (HSI) Long-Term Technical Analysis: bear market rally with the possible bullish reversal
8 August 2016, 17:07

0
388
Weekly
price is located near and below 100 period SMA (100 SMA) and 200 period SMA (200
SMA) for the secondary bear market rally with the possible bullish reversal. Price is located to be
within the following key support/resistance levels:
- 22,579 resistance level located near 200 SMA on the border between the primary bearish and the primary bullish trend on weekly chart, and
- 20,285 support level located far below 100 SMA/200 SMA in the primary bearish area.
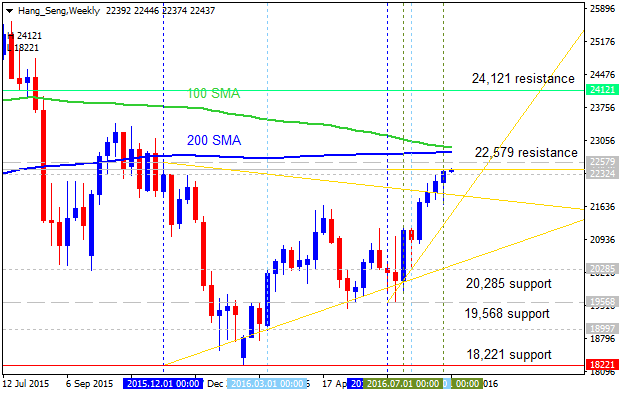
Ascending triangle pattern was formed by the price to be broken to above for the possible bullish reversal to be started in the future.
- If the price breaks 22,579
resistance level so the reversal of the price movement from the bearish
to the primary bullish market condition will be started with 24,121 level asa nearest bullish target.
- If price breaks 20,285 support so the primary bearish trend will be continuing with 19,568 target to re-enter.
- If not so the price will be ranging within the levels.
| Resistance | Support |
|---|---|
| 22,579 | 20,285 |
| 24,121 | 19,568 |


![[Two Different Approaches to Market Timing]: The Spiral Calendar and the VISTmany Research Project](https://c.mql5.com/6/1012/splash-preview-771691.png "[Two Different Approaches to Market Timing]: The Spiral Calendar and the VISTmany Research Project")

