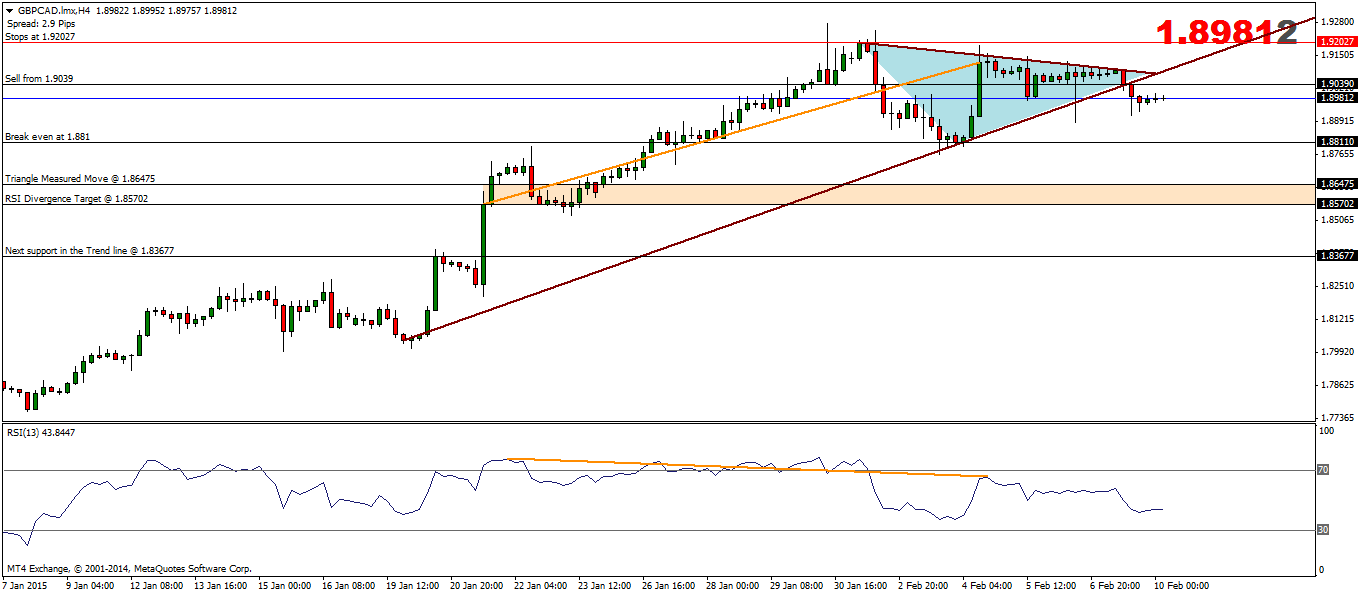
GBPCAD is a currency pair that trends in a nice fashion. The pullbacks offer traders a nice place to enter on the longs. In this trade analysis for GBPCAD, we primarily focus on a counter trend trade idea based on the following factors.
- RSI Divergence: There is a strong bearish divergence as price makes higher highs but RSI declining. What's interesting in this currency pair is that the correction is due to end near 1.857 levels. With price breaking down from the short term support level, we await a retest towards this support at 1.9039 to take a short position.
- Trend line break: There is also a trend line break. This trend line was well respected since mid January and the bearish break out indicates a possible correction to the downside. The first support in the trend line comes at 1.8811, followed by 1.83677
- Triangle formation: Price action entered into consolidation/congestion phase at the top forming a triangle pattern. The measured move of this triangle comes to 391.7 pips. Considering the break out happened at 1.9039, we get a measured minimum price target to 1.86475 (which incidentally falls close to the RSI divergence target)
Considering the above factors, we can therefore look towards taking a short position near 1.9039 with stops at 1.92027, targeting 1.86475, while moving the trade to break even when price touches 1.881. In terms of risk, we have about 163.7 pips in risk, while targeting 391.7 pips. The trade also comes with a GFD, with order set to expire by end of day if we do not see the order being triggered.
The chart below for reference.


