This is my first post here blogging about my trade set ups and also my trading strategies. This week I will focus on 2 pairs, CADJPY and EURAUD.
CADJPY
My analysis starts with the weekly charts.
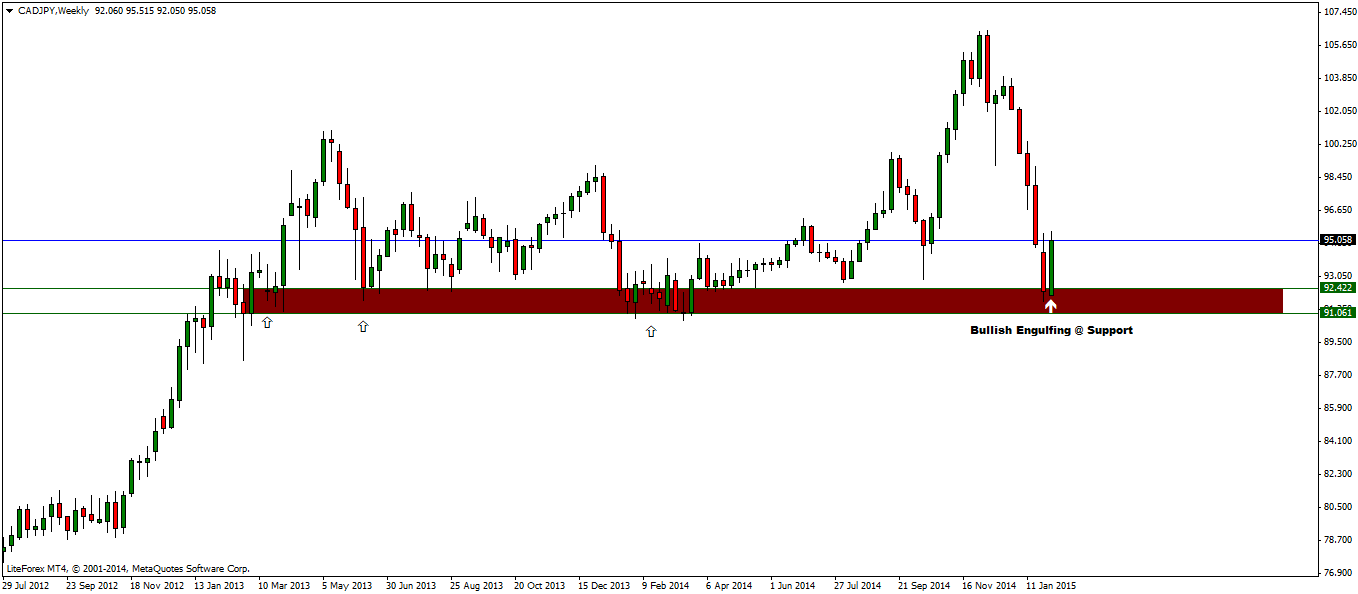
Here we notice a bullish engulfing pattern formed at a major weekly support/resistance level. Looking to the left, we see three tests to this support level since 2013, making this a strong level. Only a strong fundamental news could possibly break this level. Anyways, the appearance of the bullish engulfing pattern forms the basis for CADJPY long entry.
Switching to daily charts, we notice a lot of things happening.
- First, the black trend line (thick too) is an old trend line that has been breached. This indicates that we could look for a downtrend to start in some months.
- Secondly, the blue trend line a newer one was broken. There was a support level at 100.086, which is waiting to be tested for resistance.
- In the move down after the break of the (blue) trend line, there was an intermediate support formed at 97.062.
- Price broke down only to consolidate near a previous support at 94.078. Remember that from the weekly, price formed a bullish engulfing, which explains the reversal in the Daily charts.
- We also find a piercing line candlestick formation made on 2nd February after which price started making higher highs.
- With RSI, there is a lot of divergence also being formed.
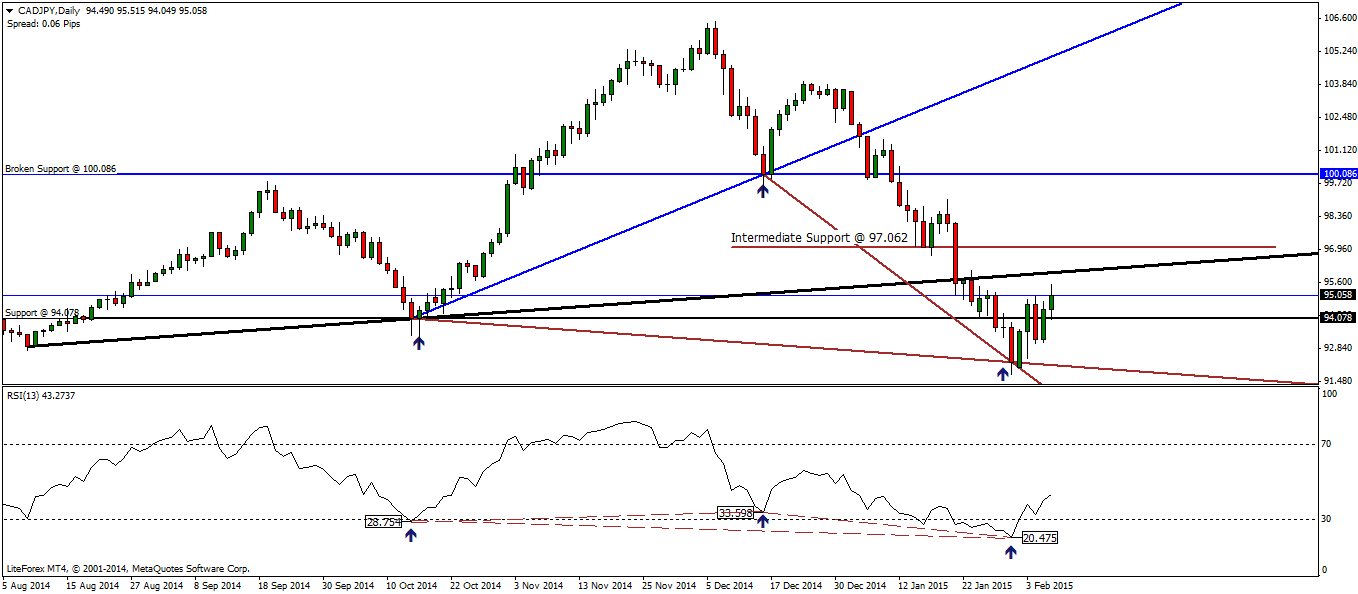
So, the view is that CADJPY could fall a bit more to establish support at 94.078 and then it would rally to 97.062 and finally to 100.086 (or 100, rounded off).
And finally, the H4 charts, from where we take the trades.
- Here, a major falling trend line has been broken and we also plot a rising trend line.
- While the break out happened few days ago, there is no retest, which is where we look to enter.
- From the Daily charts, we notice 94.078 being the support level. So one position will be taken at 94.078 and a second position will be taken at 94.54 (in the event price misses the test of support).
Assuming the rally continues, the targets to the upside would be 97.062 (the intermediate support), 98.038 (minor support from the H4 charts and finally 100, the main target.
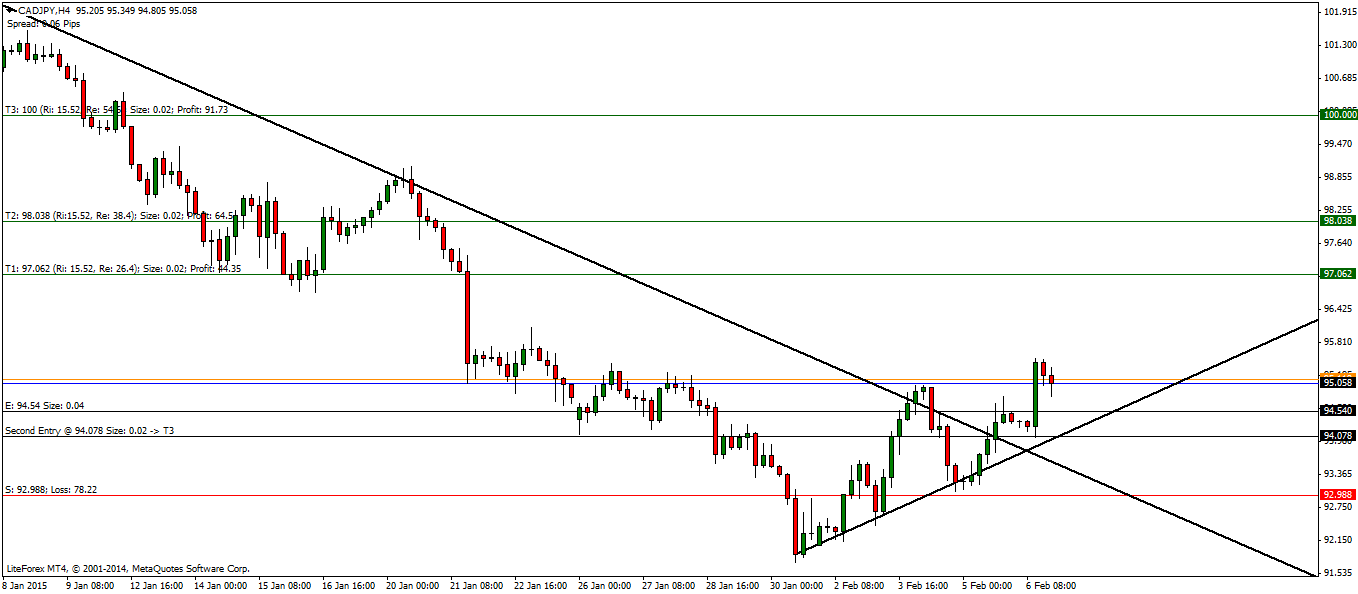
In terms of trade management, this entire trade has a fairly decent Risk/Reward and with 3 positions being traded (2 at 94.54, 1 at 94.078) both with stops near 92.988, we can expect to be fairly well positioned.
EURAUD
With EURAUD, the trade idea is very straight forward.
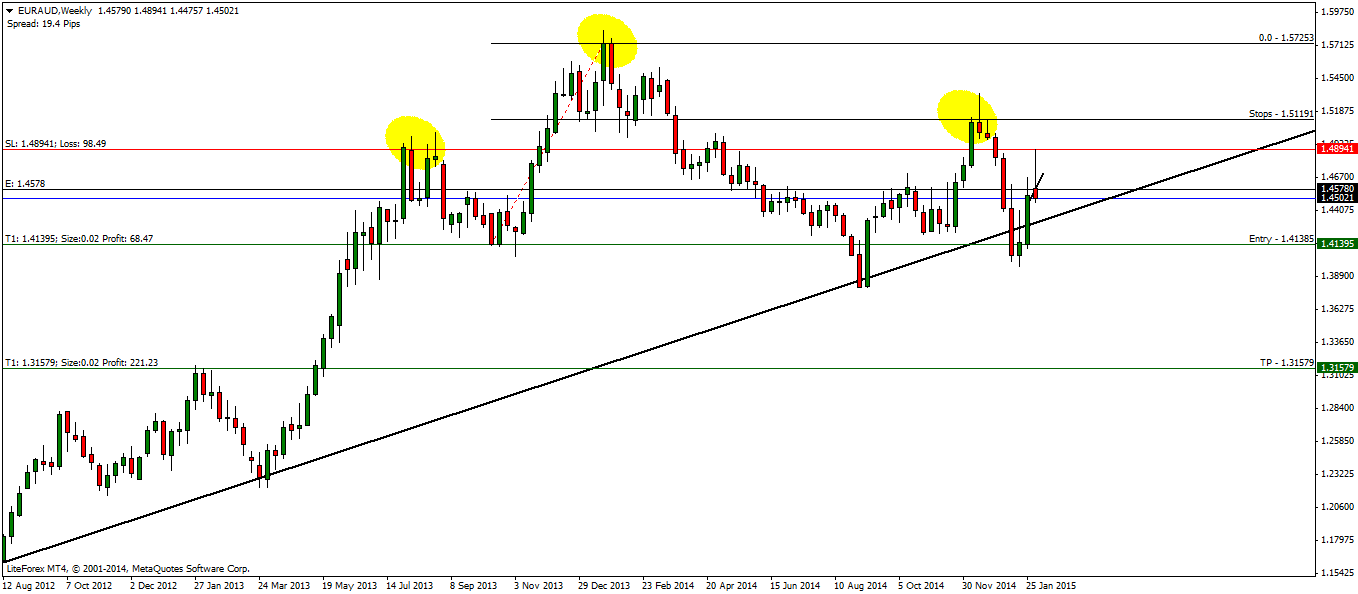
- On the weekly charts, we notice a head and shoulders pattern that has been forming since May 2013. This pattern is still above the neckline at 1.4578.
- While the H&S pattern forms the main basis for this trade, there are other evidence of prices as well.
- Mainly the spikes. Notice the right shoulder's first spike, dark cloud cover, followed by last week's sharp pinbar/emerging shooting star type of pattern that opened with a gap up and then closed.
- Technically, this week could see either a Doji or a sharp decline.
The major H&S gives a minimum downside price target to 1.3158, which forms our final target or T2.
When we switch to the H4 charts, we then notice another small head and shoulders pattern being formed. This appears after a sharp corrective rally and this indicates the end of this correction.
Here, we notice 1.4578 being the neckline (although 1.4625 - 1.4625 could also qualify), which forms the second entry price.
This smaller H4 head and shoulders gives a target to 1.427, but considering it is just a minimum objective, and that larger long term support or neckline comes at 1.41385, we will take this second level as the first target level.
So, by the time price reaches the major head and shoulder's neckline, we already make a profit while the second trade is ready for more profits, trading risk free.
The stops are conveniently placed near the high at 1.4894, because if price rallies to this level, the trade would be invalidated (the H4 head and shoulders), while we wait to see what future price action will tell us.
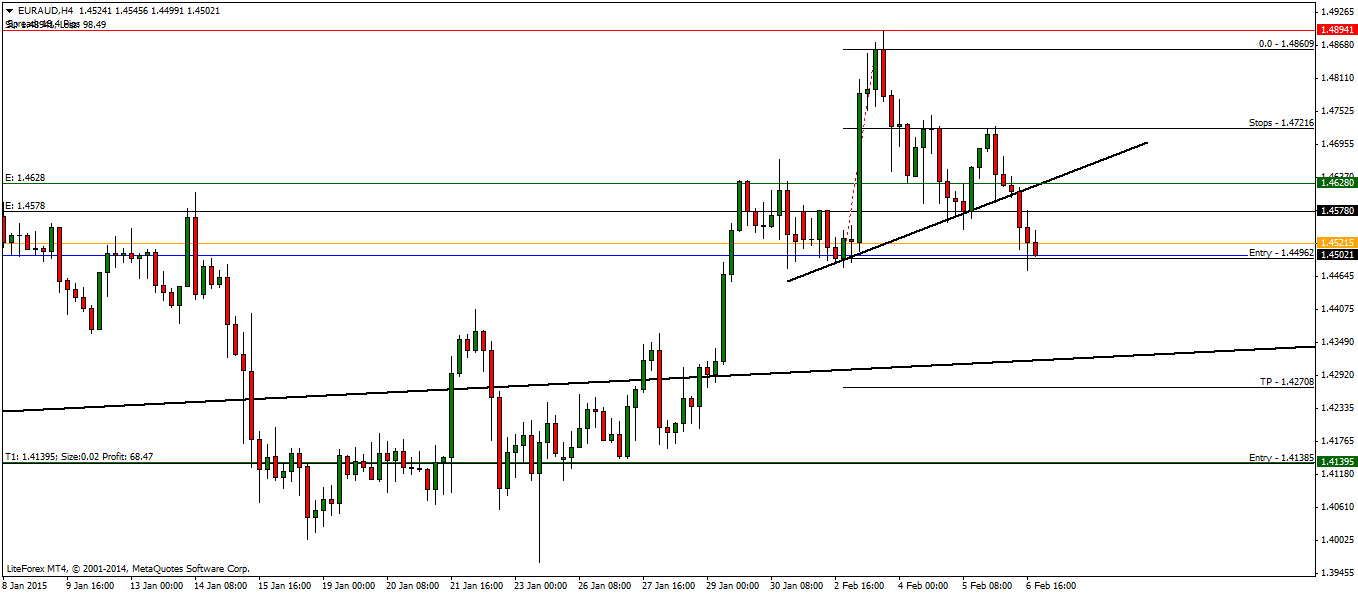
In terms of the risk/reward, this set up also offers a very good risk/reward ratio.
So CADJPY and EURAUD will be the two pairs that I will be focusing on for this week.


