

Find the Daily Trend
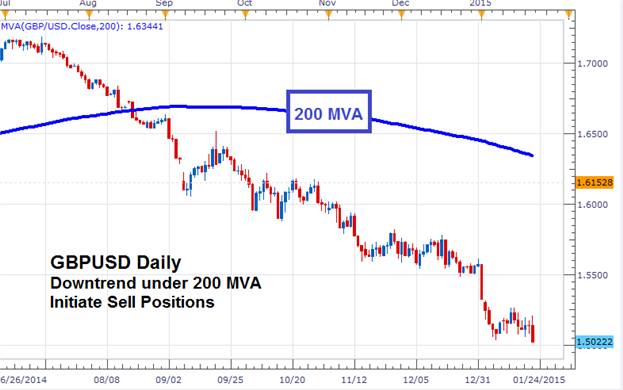
Using this strategy - we are going to find entries with the trend when price breaks from a key point of support or resistance. Since we will be selling in a downtrend and buying in an uptrend, the first task of this strategy is to find the trend. To begin traders will need to identify the primary trend on a Daily chart. A 200 MVA (Simple Moving Average) will be used for this. At this point, traders should note whether price is above or below the MVA.
Below we can see an example of the 200 MVA at work on a GBPUSD Daily chart.
Identify Support & Resistance
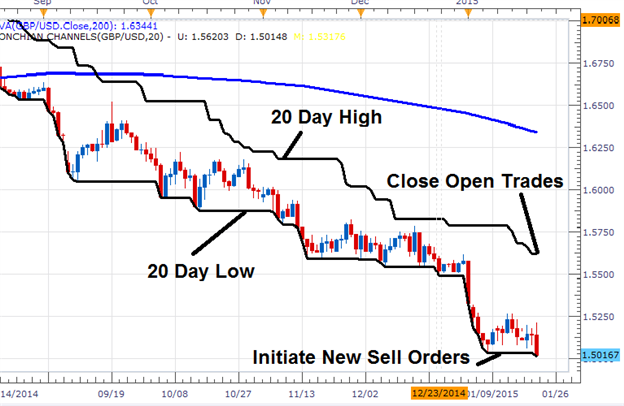
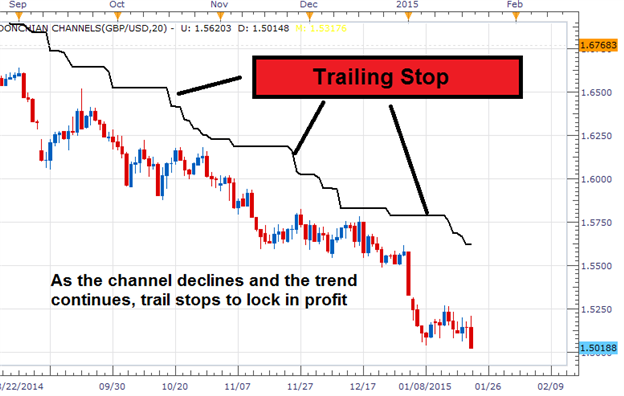
Donchian Channel is technical indicator that can be applied to any chart. Their primary use is to pinpoint current levels of support and resistance by identifying the high and low price on a graph, over a selected number of periods. You can see these channels displayed in the graphic below, and this information will be carried over for our entry strategy.
Open the trades
So - we have identified both the trend and support/resistance, it is time to plan an entry into the market. In downtrend (price under the 200MVA), entry orders to sell the market should be placed one pip under the 20 day low. The idea is, when support is broken in an uptrend traders will look to sell. Conversely, in an uptrend traders will look to buy the market one pip above the 20 day high. This way orders can be set, and traders can trade breakouts occurring at any time of day without having to be in front of their computer.


")
