This is the manual for the Zone Trader EA available here: https://www.mql5.com/en/market/product/127753
The EA is a manual tool for traders to automatically take trades at support and resistance or supply and demand zones using price action entries within those areas. It is designed to be used as a position trading tool meaning there are no fixed stop losses used. Trades that work out are simply banked and the profit taken, trade that do not work out are turned into position trades using DCA scaling in techniques to adjust the average price level, the target zone is then adjusted to the next logical area price will target above or below the average price.
Recommended timeframes to be traded are the hourly timeframe and above as this is meant as a swing trading tool/strategy, but you could use the EA on any timeframe. Just be aware the lower you go the more "chop" you will experience in daily market movement and the less reliable trading zones will become.
The EA has multiple features which will be covered here and is also designed to be used as a training tool in the strategy tester in MT4, so you can practice trading zone bounces and position trading techniques to hone your skills at identifying obvious levels to trade from, and towards.
WHAT THE BUTTONS DO
Each button has a specific function designed to allow you to either draw zones or close existing trades you have open.
The buy and sell limit buttons when pressed will place the zone above or below current price and offset the closest edge of the zone to whatever you have input as the multiple of ATR away from current price. Hitting this again if a zone is in place will automatically reset the zone to the same distance it was initially drawn. If a zone has been disabled as it's already been traded and you want a new live zone drawn you simply hit the button again.
EXT - Extends the zone across to the hard right edge of the chart so you can see where it is in realtion to current price and the next entry level.
BUY LIMIT - This will place the buy zone below the current price
SELL LIMIT - This will place the sell zone above the current price
CLOSE - This will close ALL trades that are open on the instrument you are trading
CL OLD - This will close the OLDEST trade on the instrument you are trading. Used for drawdown control when a position may be pushing against you and you want to scale out of the older parts of the position and take a loss on those trades
HOW TO USE THE ZONE TRADER EA IN THE STRATEGY TESTER
The EA functions fully in the strategy tester allowing you to practice trading with the zones.
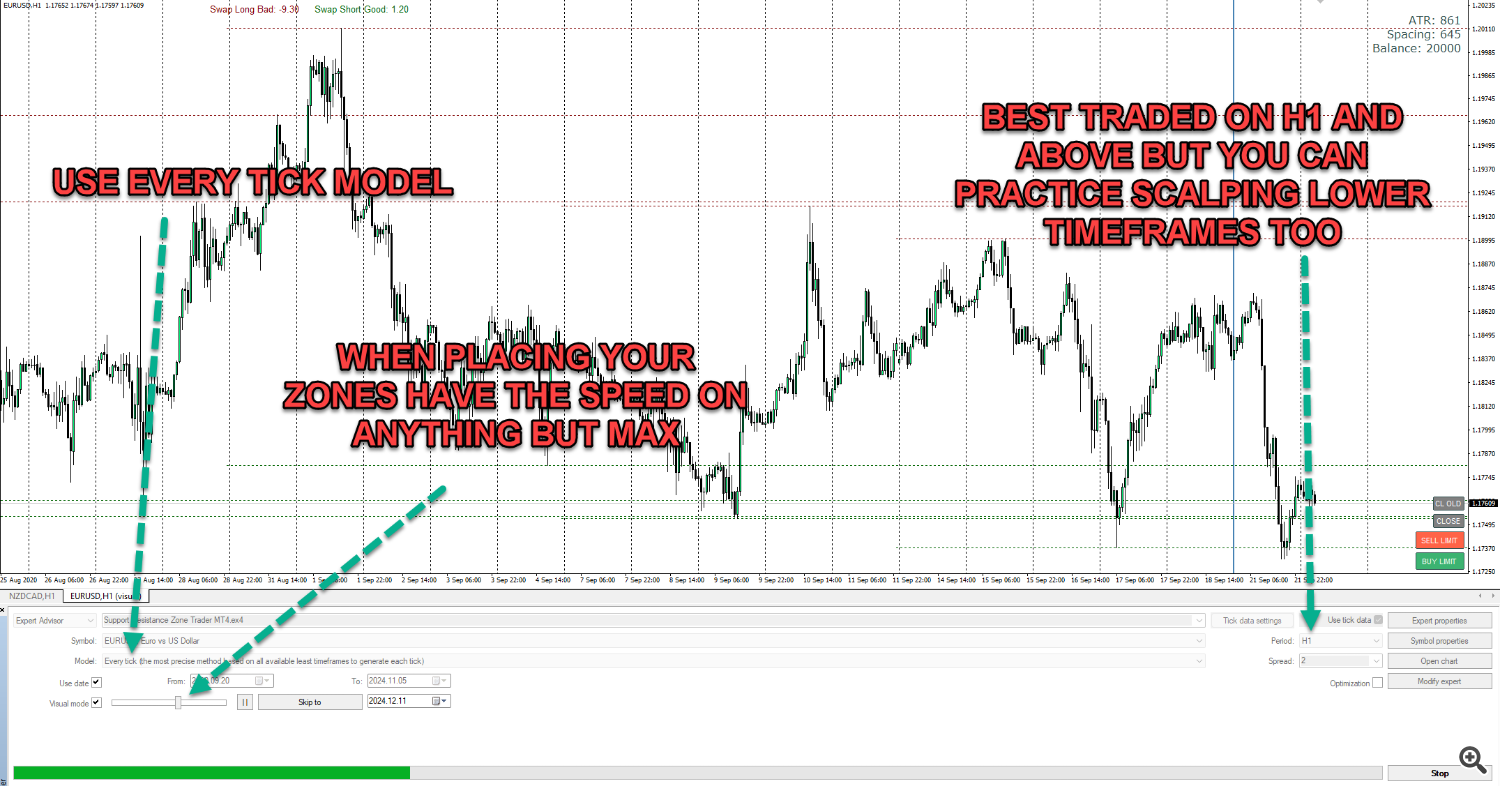
- Simply start the backtester in every tick model so the speed is not too fast.
- Use a slower than max speed when the EA starts and place the zones where you want them.
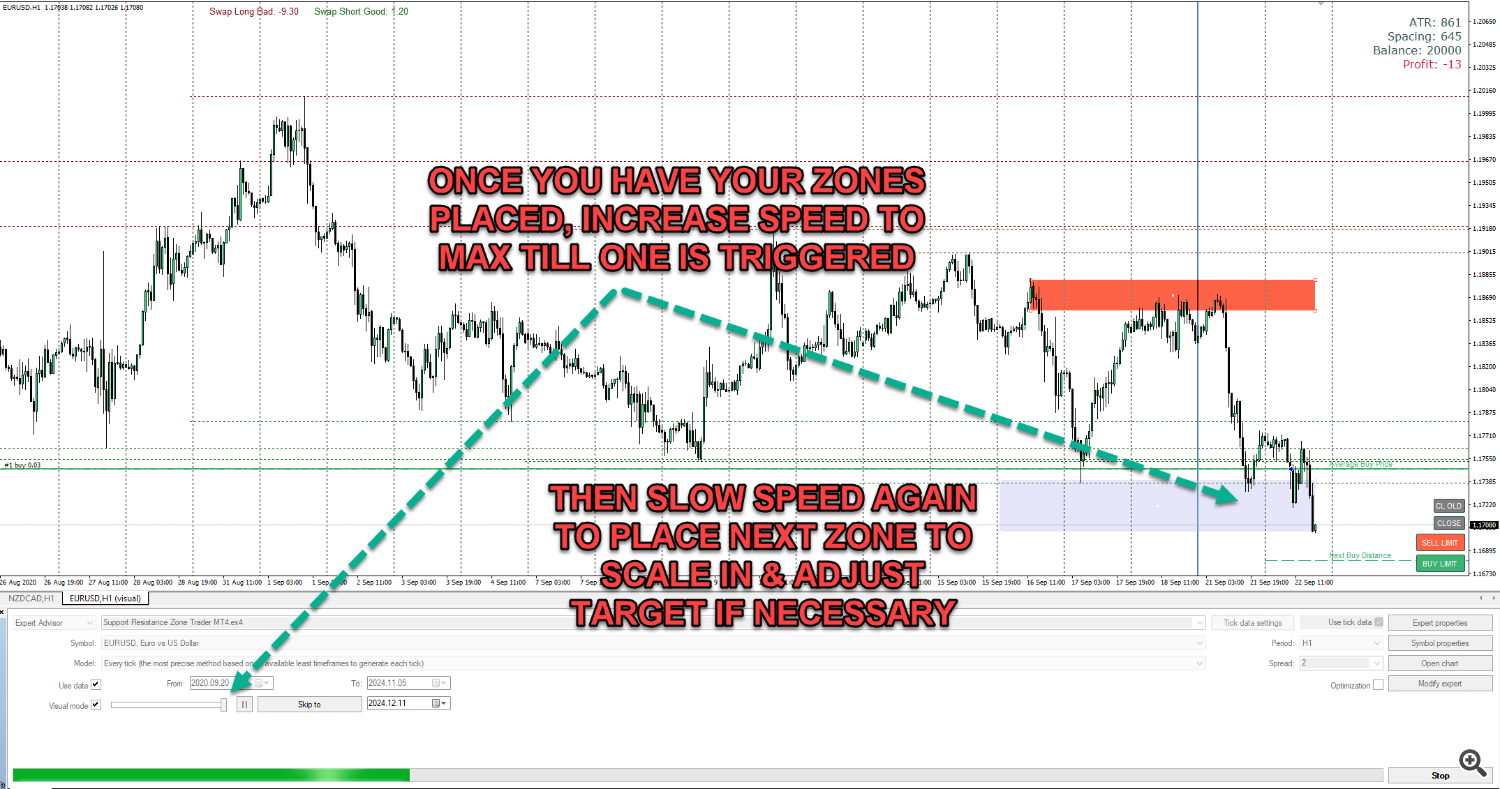
- Then speed up the EA to max speed until a zone is triggered and slow the speed again.
- This now allows you to adjust the target zone if required and place the next entry zone in case your initial trade does not work out.
- Every time a new trade is placed your average price will adjust and that is when you want to adjust the exit target zone.
- Repeat over and over again until you are comfortable with the strategy and you can see how you would have done over a period of weeks, months and even years.
This excercise trains your brain and "burns" price action into your eyeballs which will help your muscle memory identify key levels when doing analysis every day. The more time you spend watching different instruments fly past, and the more you trade them in the simulator, the more accurate your entries will be in real trading. Another good reason to use the tester is to help you manage expectancy with your trades. As you see the weekly seperator lines fly past you will understand better how long trades take to play out with whatever strategy you are using with the zones. If you look back at any test you have done once completed (turn off delete drawn objects input) you will be able to see how long on average you are in single trades and trades with more than one position. This helps you become more patient when trading in a real account. Knowing a trade takes on average 2-3 days to work from zone to zone will help you be more patient when the market is just fluctuating up and down and going nowhere, as you will have seen that scenario play out over and over again in the tester.
HOW TO USE IN LIVE TRADING
Trading with the tool in a live account environment requires a VPS or a PC that is left on 24/7 in your home or office. This is for two reasons, first when your terminal re-starts, EAs are re-initialized meaning they reset which will remove any zones you have drawn on your chart. Secondly you do not know WHEN price will reach a zone and if you are asleep and you trading PC is off you will miss entries. The markets move constantly and do not sleep, your trading should not either. One exception to this is for traders who may be using the EA intraday on low timeframes and closing out at the end of each day. Then a VPS is not required.
A seperate chart for each instrument you would like to trade should be opened on your terminal and left open with the EA running on it, it's fine to change timeframes on the chart you are analysing to find good levels to trade. The EA works on candle close for entries and exits so set the timeframe to the one you would like to use to trigger entries. Most people will swing trade on H1, H4 or higher timeframes so these are the best to run the EA on, there is no "best" timeframe so it's personal preference.
The EA will detect the name of the instrument and combine that with the magic number, which you can leave default unless trading the same instrument on more than one chart in the same terminal. This is how is knows what trades it should be managing.
STRATEGY & ANALYSIS
Trading using zones is very simple, don't over think it!
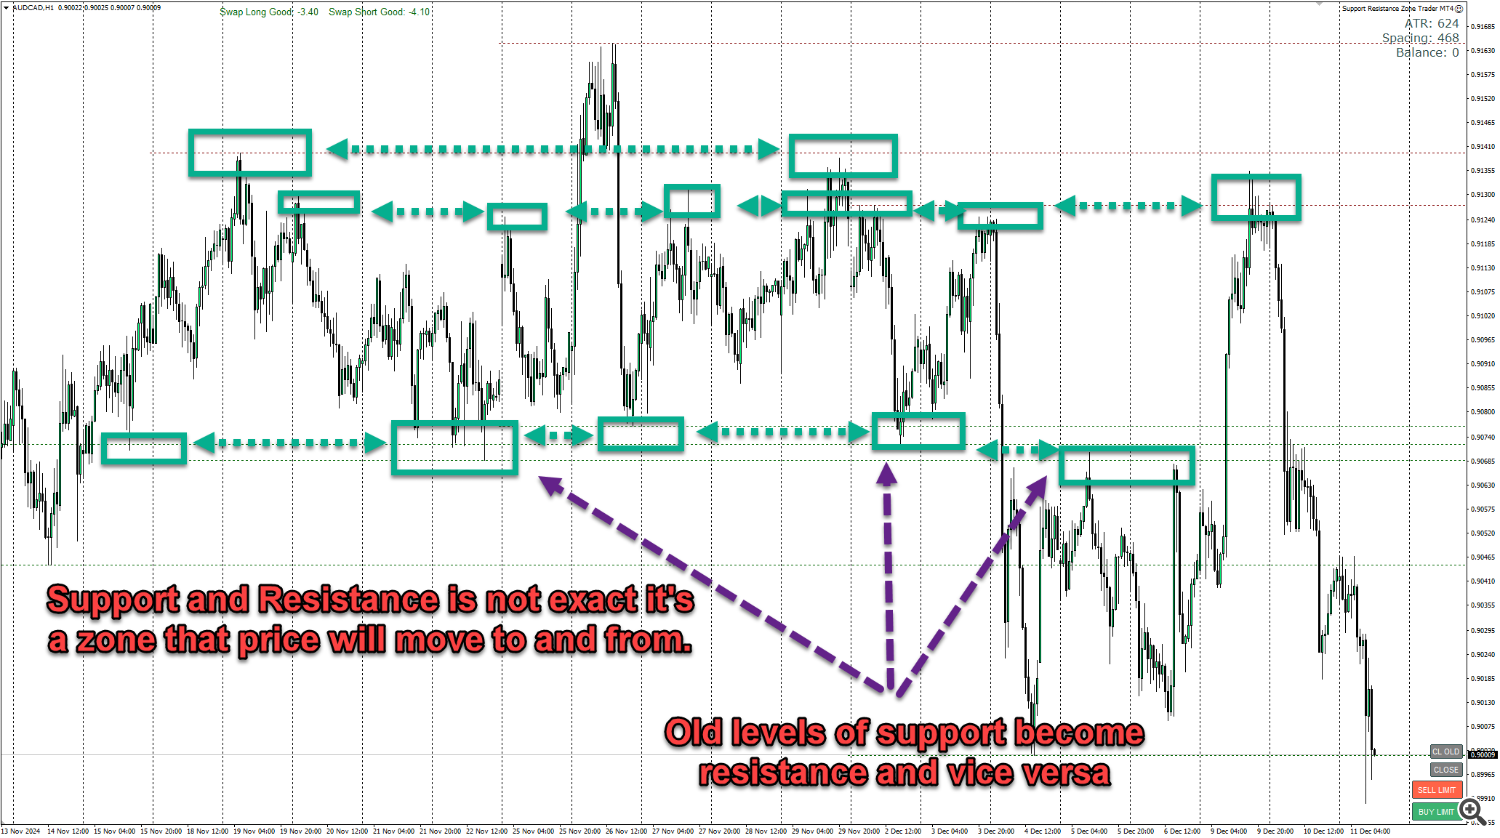
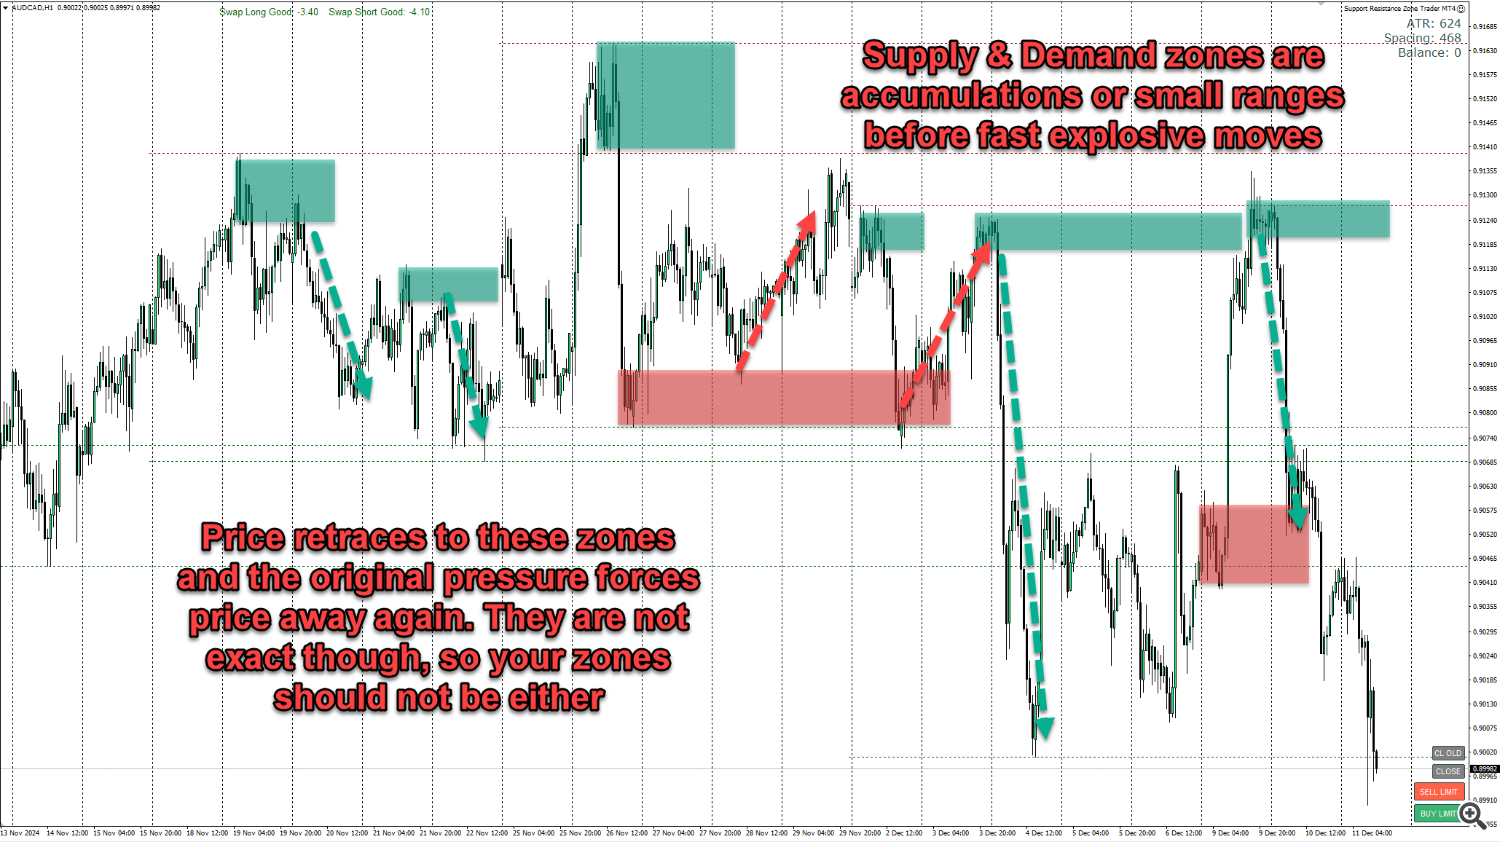
All you do is place the buy and sell zones where you think price is heading to. Price spends 80% of the time moving in ranges and narrow trends searching for previous price points it has reacted at. You can easily identify these areas as they tend to be daily, weekly and monthly turning points for support and resistance, and for supply and demand they are the small accumulations or ranges before an explosive move. Those are the two main strategies that are best traded with the EA.
Recommended use for the EA and zone trading strategies is to simply check your charts once or twice a day. Analyse each instrument and place a buy and sell zone at the points of interest. Then leave the days price action to play out. The next time you look at the charts one of two things will have happened.
1. Price will have moved to a zone and triggered a trade. Now you can simply place a new zone in the same direction behind your entry at the next backup support/resistance or supply/demand area. Then move onto the next chart and repeat.
2. Price will have NOT moved to either of the zone you have placed and you can just move onto the next chart.
That is as simple as it gets. Don't over think, adjust zones or try to do anything else. Price will do what it does and you have no control over it so let the price action play out day by day and wait for zones to be reached.
Checking every morning before you go about your daily routine and before you go to bed is more than sufficient to manage swing trading strategies.
THE PROBABILITIES OF TRADING ZONES
Think about price movement for a moment, think about what it does every day. It moves up, and it moves down over time throughout the day. That is ALL it does and ALL IT CAN DO every single day.
The probabilities of each zone you place on the chart getting hit is 50%. It can be nothing else as the market is binary, it can only go up or down so there is a 100% chance that ONE of your zones will be reached on any given day.
So, simply place the zones and see what price does when it gets there. If it reaches your zone and reverses you simply wait for it to hit the other zone which will take profit on your trade. If you are using the "always in " method you will then instantly get in a trade in the opposite direction. so you simply place the opposite zone where you think price may go next.
If it reaches your zone, triggeres a trade and DOES NOT reverse and continues past your entry, taking you into drawdown, it has a 50% chance of either moving to your next zone to take a second trade in the same direction OR a 50% chance to not get to that zone. The it will reverse and go to the profit zone you have drawn. There are only ever 2 outcomes, right or wrong, turn or not turn, hit target or not hit target. People over complicate trading looking for multiple indicators to help them make a binary decision become something different, which it cannot. It does not matter how many indicators you have, how good a backtest has been, what a guru "claims" the strike rate of their indicator or stratgy is. Every time you enter a trade, for wahtever the reason, the probabilities of the trade reaching your target ae 50%. It WILL or it WONT! Your job as a trader is to trade, place risk inthe market and WAIT. The outcome will be what the market makes it be, you DO NOT have to take a loss because your initial entry was incorrect, you simply need to look at where price wil head next, adjust your zones and wait more.
If you enter a trade and it goes against you, let it, simply enter another trade at the next logical area price will move to and CHANGE YOUR ENTRY PRICE by averaging the two trades together. This is called position trading or dollar cost averaging. Banks and institutional traders have been doing this for decades, it's all they do. Watch Bloomberg TV when you get the chance, listen to the fund managers and institutional talking heads and pay attention to what they say when they are interviewed. They are asked what their "position" is on Gold, Oil, USD etc... You will never hear then teall you where their stop is or their TP is, they WILL however tell you their position, it's long or short, thats all it can be, the market is binary, trade it that way.
INPUTS EXPLAINED
<<<< MAIN SETTINGS >>>>
EA works when bars close (false = on every tick) - Certain functionality in the EA can be made to work on the close of a candle rather than every tick. This speeds up back testing and ensures some calculations and checking for price targets are done only when candles close, not on every tick. For live trading, you may want this to work on tick, but not necessary.
Functions affected by this includes:
- Messages when a zone is too close to a previous trade level
- ATR & P&L data shown for trades
- Exiting trades at a monetary amount
- Trailing stop losses
Always In Mode (Exit when opposite zone trades) - When set to true, If you were long the EA will close long trades when a sell zone is reached and price triggers an entry, then automatically get into a short trade so you are "always in" a trade in one direction or the other. Opposite functionality for short trades.
If you set this to false, the EA will just exit the current trade(s) when the zone is reached and price action triggers but not enter a new trade in the opposite direction.
Extend zones if price exceeds them (deletes if false) - If set to true when price reaches a zone and a candle closes the opposite side of a block (goes through it) the EA will automatically expand the size of the zone to include the candle that closed outside the zone. Then wait for price action to reverse to take a trade. If you set this to false and price goes through a zone without a signal, the EA will delete the zone and wait for you to draw a new one.
Zone width in candles - This is the width of the zone the EA draws on the chart, counted in number of candles back from current price.
Zone height as ATR percentage - This is the height of the zone drawn with the buttons as a percentage of the ATR setting you use (inputs below) and it's advisable to use the daily timeframe (ADR - average daily range) for this which the EA is set to as default.
Zone distance from current price as ATR percentage - This is how far away from current price as a percentage of the ATR figure you use to draw the closest edge of the zone. Set this to something that you know price will not reach quickly depending on the timeframe you are trading on. Around 1/4 of ADR is a good level initially to give you plenty of time to adjust the zone before price moves into it.
**** PRICE ACTION SIGNALS ****
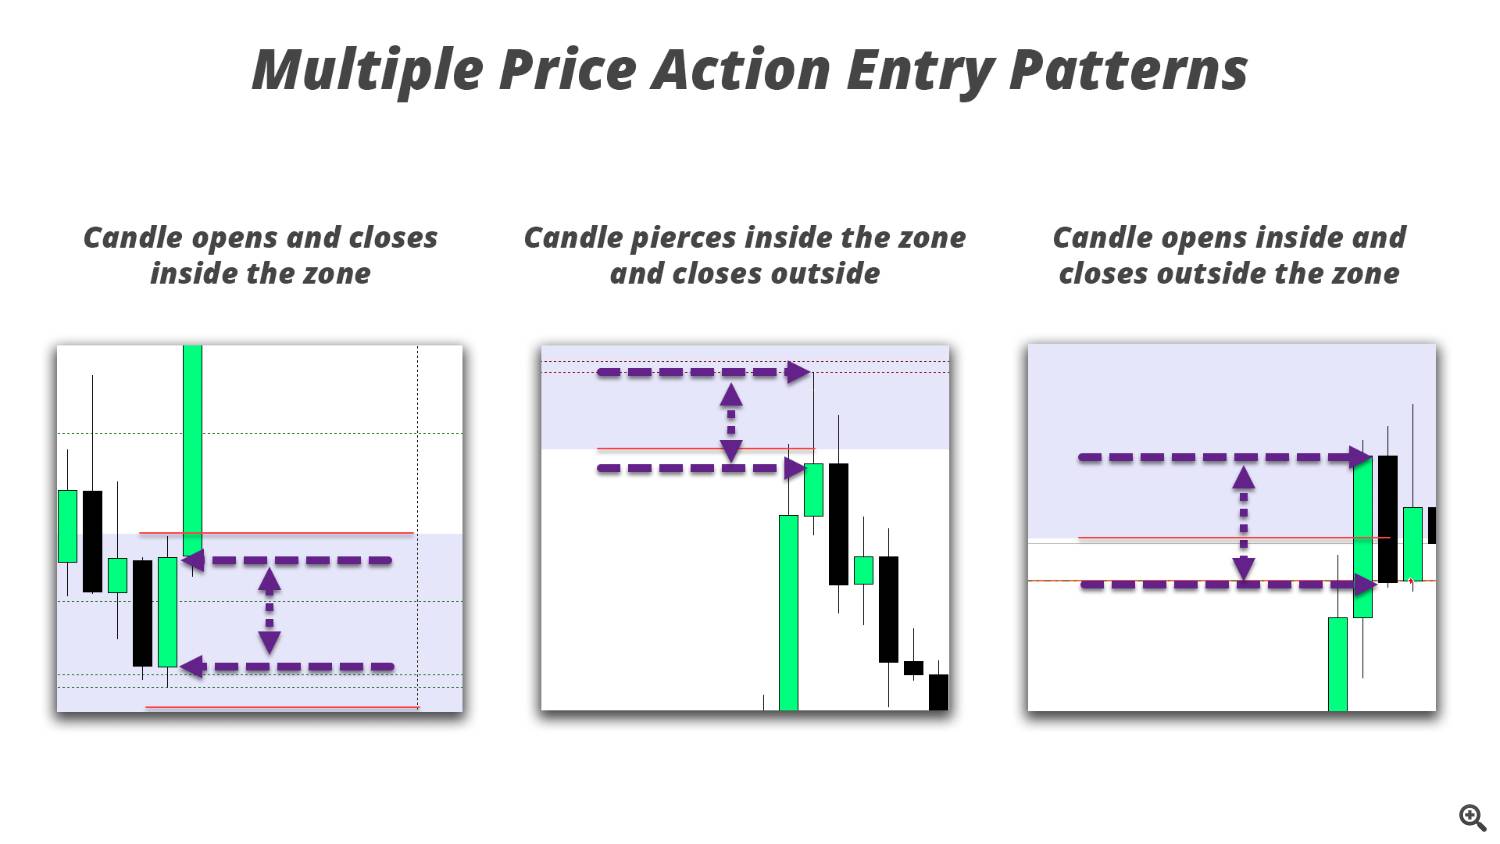
Enter if piercing into zone - For a sell zone the last closed candle must have a high above the low of the zone and the close of the candle below the low of the zone. Opposite for a buy zone.
Enter if open inside and close outside zone - For a sell zone the last closed candle must have the open above the low of the zone and the close of the candle below the low of the zone. Opposite for a buy zone.
Enter on price action inside zone - For a sell zone the last closed candle must have the open above the low of the zone and the close of the candle also above the low of the zone. Opposite for a buy zone.
**** RISK SETTINGS ****
Amount to risk over 1 ATR (0 = use lots) - If NOT set to 0 this will be the amount of money the EA risks over 1 measurement of the ATR you have selected in the inputs below. It is recommended to use ADR (daily range) as this ensures your trades have room to breathe. When set to 0 the EA will default to using a fixed lot size.
Fixed lot size for first trade - This is the initial lot size the EA will use to trade with.
Martingale lot multiplier for additional trades - This is the multiplier to increase additional trades taken in a position by. e.g. if your initial trade is 1.00 lot and you set this to 1.5 then your second trade will be taken at 1.50 lots. The next at 2.25 and so on until all trades in a single direction are closed out either manually with the buttons or by hitting the opposite zone.
Min distance between entries as multiple of ATR - This is the minimum spacing between each trade and the EA will not trade if the candle closes within this distance. Ideally you would use a percentage of ADR (average daily range) to space your trades out so there is not too much drawdown but your average price is also not kept too far away. The EA will draw this level on the chart to aid you in placing your next zone for additional entries outsize this area. A visual warning is displayed on the chart if the zone you have drawn is too close. Somethere between 0.5 and 1 ADR are good guides for trading daily levels using H1 timeframe and above.
Only trade in direction of good swaps - If true then the EA will not take trades if the swap is worse than your maximum set in the input below. The zones will still act as exit points for any positions you have on that reach them but if using always in mode the opposite trade will not be taken.
Maximum negative swap you deem too expensive to trade - If the above is true this is the maximum negative swap which determines if the data displays as good or bad. This does not affect trading done with the EA. Enter as a negative number, e.g. -5.50
**** ATR CALCULATIONS ****
ATR timframe - This is the ATR timeframe used for all ATR calculations for distancing, trailing stop and risk in the EA. The default is daily so the EA uses ADR (average daily range) as a guide for spacing and risk parameters.
ATR period - This is the number of periods (candles) back to calculate the ATR. If using daily anything from 2 weeks to a few months is a good measure to guide you as to what the instrument you are trading moves on a daily basis. The higher the number the more smoothed and less change you will see in the calculation and levels/risk being used.
**** TRAILING STOP LOSS ****
Exit using a trailing stop based on ATR - If set to true each individual trade will start to trail a stop loss either on tick or candle close (based on the input in main settings) using whatever inputs you use below.
Multiple of ATR for trailing stop - This is a multiple of the ATR figure you use (ADR recommended) to add and trail a stop by as price moves in your direction.
Multiple of ATR to start trailing stop - The trailing stop will not start until price has moved this far into profit. Ideally set both of these to the same setting to allow your trade room to breathe.
Trail stop loss to breakeven only - If set to true the EA will stop trailing once the stop is above your entry price. NOTE: If using candle close this may lock in profit for you also depending on the size of the candle that closed above your entry.
**** EXIT AT END OF DAY OR CANDLE ****
Exit trades at set time every day - When set to true the EA will automatically close out your trades at a set time. This is useful for those trading intraday on lower timeframes that do not want to hold overnight.
Time on chart to close trades at every day - Enter the time you want the EA to close your positions if the above is set to true. Format is HH:MM, e.g. 22:30 would be 10:30pm.
Exit trades at close of candle on specific timeframe - If set to true the EA will check on the close of every candle on the timeframe you choose and close trades.
Timeframe to exit trades at candle close - Select the timeframe you want to close trade on if the above is set to true.
Only exit if trades are in profit - If set to true the above options for closing trades will only happen if a specific profit amount has been reached. This input is particularly useful for scalping strategies and allows you to set and forget the EA and take whatever profit is available every hour or 4 hour period.
Minimum profit to close at - This is the amount of money you would like as a MINIMUM when the candle time or end of day time above is reached.
**** EXIT AT MONEY TARGET AMOUNTS ****
Exit at an amount of money in profit - If set to true the EA will monitor your open trades and automatically close them out individually if they are above the set amount. This is used for closing losses as well as profits.
Amount of money to exit trade in profit - Enter the amount of money in profit for an individual trade to be closed out at.
Amount of money to exit trade in loss (- neg number) - Enter the amount of money in loss for an individual trade to be closed out at. NOTE: This should be entered as a negative number. e.g. -200 will close out when you are 200 in drawdown on the trade.
**** EXIT AFTER AMOUNT OF TIME ****
Exit after a set amount of time passes - If set to true individual trades will be closed out after they have been open for a specific amount of time. This is useful for exiting trades that stagnate and the desired action or movement has not occurred within a set time.
NOTE: use only one and the most relevant to the timeframe you are trading on.
Number of days - Number of days to exit
Number of hours - Number of hours to exit
Number of minutes - Number of minutes to exit
**** TRADING TIMES ****
Use a time of day filter to limit opening trades - If set to true the EA will only open new trades within these times. This is designed to stop the EA taking entries during overnight swap periods when the spread can get extremely large and slippage can occur due to low liquidity. You can also use this to only trade during certain market sessions.
Time on chart to start monitoring for new entries - Time to start trading in the format HH:MM
Time on chart to stop monitoring for new entries - Time to stop trading in the format HH:MM
**** DRAWING & COLOURS ****
Show profit & ATR data on chart - When true displays the ATR, spacing, account balance and open profit data in the top right of the chart
Display swap data on chart - When true will show the swap cost information for the instrument being traded. Holding swing positions for long periods can become costly so you may want to use this to decide on a bias to trade the instrument
Week start line colour - The colour of the vertical line displayed at the start of the week. This is particularly useful in the strategy tester so you can easily see time passed in positions to condition yourself to how long trades may take in live trading. Set to none if you want to hide this
Width of weekly start line - Width of the above line
Zone buttons text colour - Colour for the text displayed on the buy and sell zone buttons
Sell colour - Colour of the sell elements on the chart including the average line, text, next entry line and the button itself
Buy colour - Colour of the buy elements on the chart including the average line, text, next entry line and the button itself
Close buttons colour - Colour of the close buttons
Traded zone colour - Colour a zone turns once it has been traded
Show previous weekly levels - Display the most recent weekly levels on your chart, this is the weekly high and low and often price reacts around these levels.
Number of previous levels to draw - The number of previous weekly levels to show on the chart
Delete drawn objects when EA removed - If set to true the Ea will automatically remove all elements it creates when it is removed from the chart. This is handy to turn to false when in the tester so you can see profit information and elements created while testing.
Text offset in hours to right of current candle - How many hours in the future from current price the labels are shifted to the right for the average price and next entry text.
Magic Number - Can be used to allow the Ea to take over trades you may have placed with other EAs if you use this same EA on more than one instance of the same instrument.

