Bollinger bands were created by John Bollinger in the early 1980s. The bands have similar theory and application with the Moving Average Envelopes. It has a set of three curves, the typical parameters are:
- Middle Bollinger Band = 20-period simple moving average
- Upper Bollinger Band = Middle Bollinger Band + 2 * 20-period standard deviation
- Lower Bollinger Band = Middle Bollinger Band - 2 * 20-period standard deviation
The theory behind Bollinger Bands is that, in a normal distribution
data set, 68% of data should fall within one standard deviation and that
roughly 95% should fall within two standard deviations. So 95% of the
price should fall within the 2-width standard deviation, which is within
the upper and lower band.
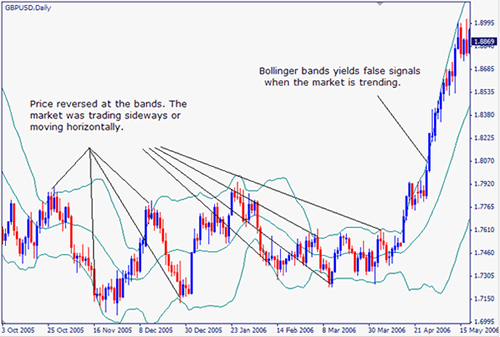
Bollinger bands are often used to forecast reversals in rangebound markets. When the price is close to the upper band, the market is more likely to be in overbought condition, and is likely to reverse. The same holds for the lower band condition.

The Bollinger bands are best to use in ranging markets, but are of limited value in trending markets. As shown on the above chart, when the market is in strong trend, the price can move along the upper or lower band, resulting in many false signals. Traders are better to combine Bollinger bands with other indicators or candlestick patterns to determine a trade.


