

The Double Top and Double Bottom patterns are quite common and easily recognizable chart patterns which occur on all timeframes and in all markets. Let’s take a closer look at this classic reversal pattern.
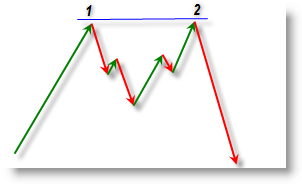
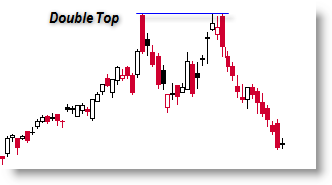
The Double Top is a Reversal pattern that is expected to occur after a lengthy upward advance in price. Buyers push prices to new highs on the first impulse up and then profit taking pushes price to a normal down-swing. Buyers step back in on the pullback but are unable to exceed the previous peak in price as sellers begin to unload their inventory, contributing to the supply/demand imbalance as price fails to make a new high and then reverses at the prior resistance level.


")
 & AMD Framework")