
Technical Analysis for Gold, Grude Oil, US Dollar and S&P 500 - Gold Prices Try to Mount Recovery, Eyeing $1200/oz Level

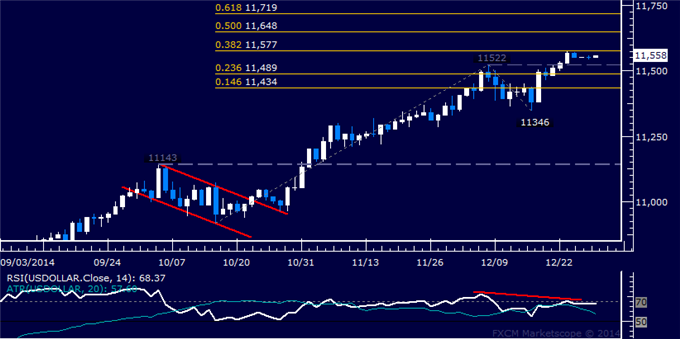
US DOLLAR TECHNICAL ANALYSIS
Prices flat-lined after hitting a
five-year high, with negative RSI divergence warning a downturn may be
ahead. Near-term resistance is at 11577, the 38.2% Fibonacci expansion,
with a break above that on a daily closing basis exposing the 50% level
at 11648. Alternatively, a turn below the 11489-522 area marked by the
December 8 top and the 23.6% Fib clears the way for a test of the 14.6%
expansion at 11434.
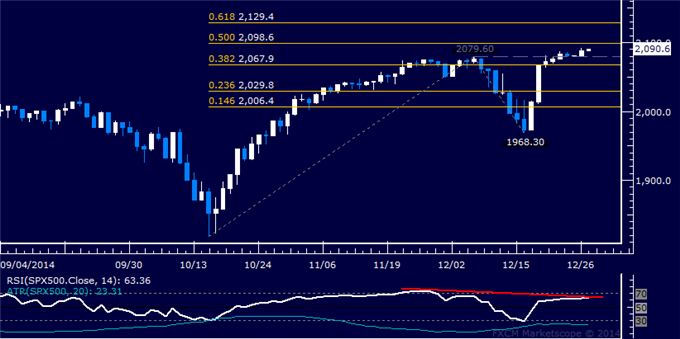
S&P 500 TECHNICAL ANALYSIS
Prices edged above the December 5
high at 2079.60, exposing the 50% Fibonacci expansion at 2098.60. A
daily close above this barrier exposes the 61.8% level at 2129.40.
Negative RSI divergence warns of ebbing upside momentum and hints a turn
lower may be looming. A turn back below 2079.60 sees initially support
at 2067.90, the 38.2% Fib.
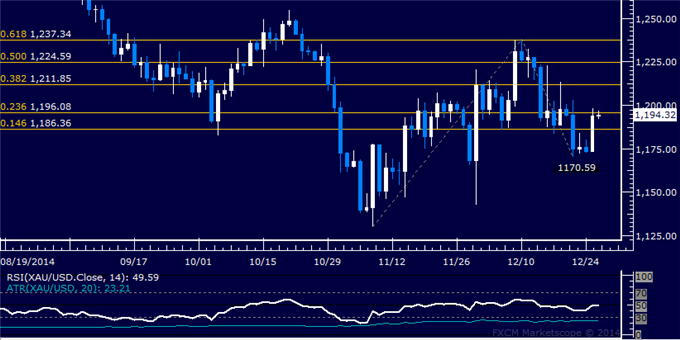
GOLD TECHNICAL ANALYSIS
Prices recoiled upward to test
resistance at 1196.08, the 23.6% Fibonacci expansion, with a break above
that on a daily closing basis exposing the 38.2% level at 1211.85.
Alternatively, a move below the 14.6% Fib at 1186.36 targets the
December 22 low at 1170.59.
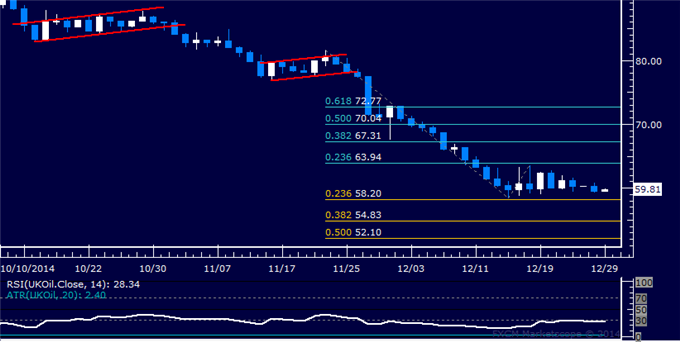
CRUDE OIL TECHNICAL ANALYSIS
Prices are in consolidation mode
above the $58.00/barrel figure. A break below the 23.6% Fibonacci
expansion at 58.20 exposes the 38.2% level at 54.83. Alternatively, a
bounce above the 23.6% Fib retracement at 63.94 targets the 38.2%
threshold at 67.31.


 & AMD Framework")
")