")

The Rising Wedge is a bearish pattern that begins wide at the bottom and
contracts as prices move higher and the trading range narrows.
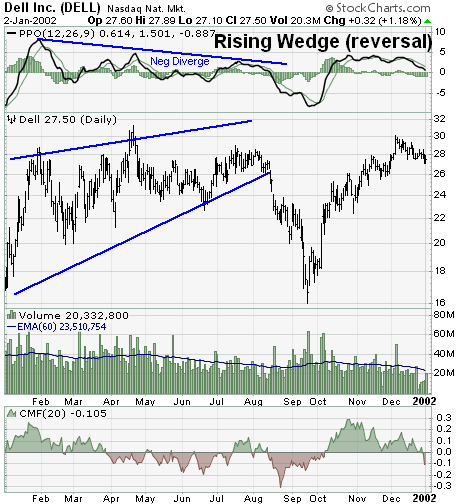
- Prior Trend: In order to qualify as a reversal pattern, there must be a prior trend to reverse. The rising wedge usually forms over a 3-6 month period and can mark an intermediate or long-term trend reversal. Sometimes the current trend is totally contained within the rising wedge; other times the pattern will form after an extended advance.
- Upper Resistance Line: It takes at least two reaction highs to form the upper resistance line, ideally three. Each reaction high should be higher than the previous high.
- Lower Support Line: At least two reaction lows are required to form the lower support line. Each reaction low should be higher than the previous low.
- Contraction: The upper resistance line and lower support line converge as the pattern matures. The advances from the reaction lows (lower support line) become shorter and shorter, which makes the rallies unconvincing. This creates an upper resistance line that fails to keep pace with the slope of the lower support line and indicates a supply overhang as prices increase.
- Support Break: Bearish confirmation of the pattern does not come until the support line is broken in a convincing fashion. It is sometimes prudent to wait for a break of the previous reaction low. Once support is broken, there can sometimes be a reaction rally to test the newfound resistance level.
- Volume: Ideally, volume will decline as prices rise and the wedge evolves. An expansion of volume on the support line break can be taken as bearish confirmation.


")
![[XAUUSD]: Weekly Liquidity Activation Points (timings), June 22-26, 2026](https://c.mql5.com/6/1013/splash-preview-771790.png "[XAUUSD]: Weekly Liquidity Activation Points (timings), June 22-26, 2026")
")