
AUDCAD Technical Analysis - Monthly Forecast for 2015: Happy Ranging Bearish

MN price.
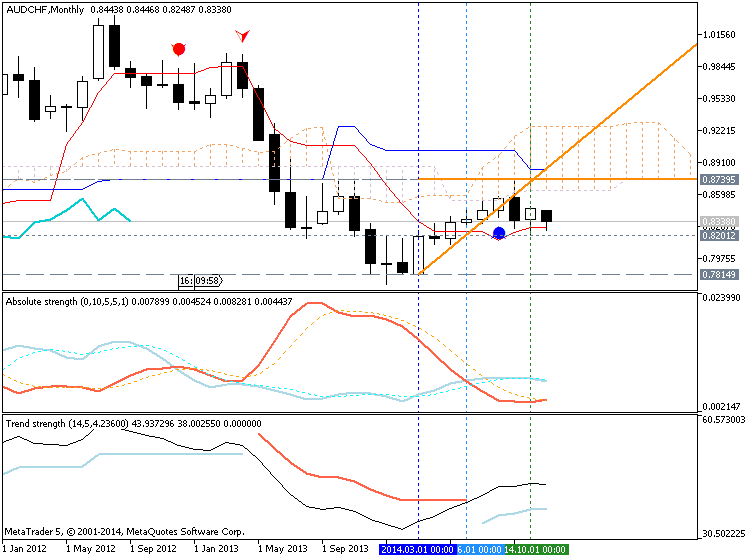
Ichimoku Analysis
The price is located below Ichimoku cloud/kumo and the nearest bordor of the cloud is Senkou Span B line which is indicating the bearish market condition. Chinkou Span line of Ichimoku indicator is located too far from the price so I am not expecting any breakout/breakdown in the near future. So, for now, I can say that it is ranging market condition within primary bearish for monthly timeframe with the possibilities to market rally.
- If the price will stay below the cloud so ranging bearish market condition will be continuing for whole next year.
- If the price will cross Senkou Span B line from below to above so we may see the secondary rally within primary bearish.
Support & Resistance Analysis
The
nearest resistance line is 0.8739. The key support level is
0.7814, and if the price will cross one of those levels so we may see rarket rally with reversal possibility, or primary bearish will be continuing.
- If
MN1 price will cross 0.8739 resistance level on close
monthly so the market rally within primary bearish will be started for monthly timeframe.
- If MN1 price will break 0.7814 support level so we will see the bearish to be continuing.
| Resistance | Support |
|---|---|
| 0.8739 | 0.8212 |
| 0.9262 | 0.7814 |
To make it shorter - I am expecting the secondary ranging market condition with the primary bearish for the next year which may be good for martingale systems, for counter trend strategies and for scalping for example.
Trading Summary: ranging bearish
If we look at patterns for MN1 timeframe so we can see bullish Retracement forming pattern:
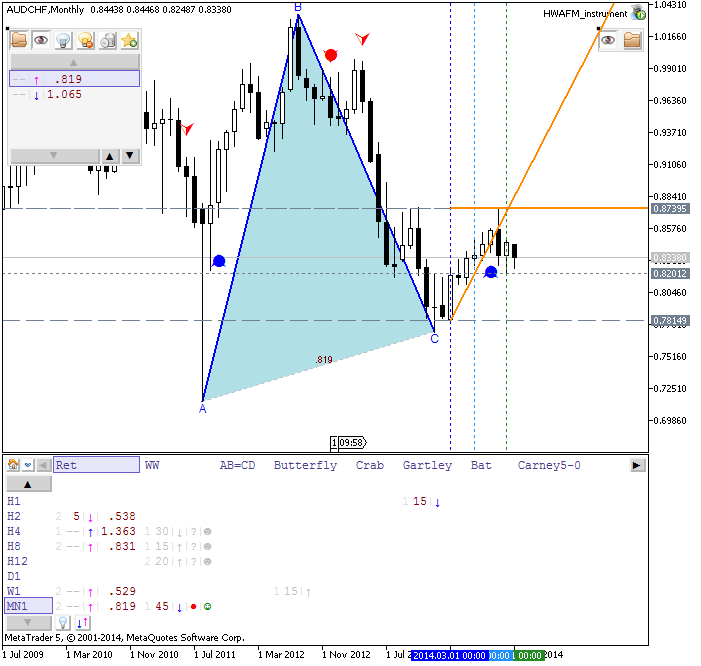
Thus, I think - most effective way to know about where the price will go to the next year is to watching the levels for MN1 timeframe. My expectation is ranging bearish.


")
 & AMD Framework")