

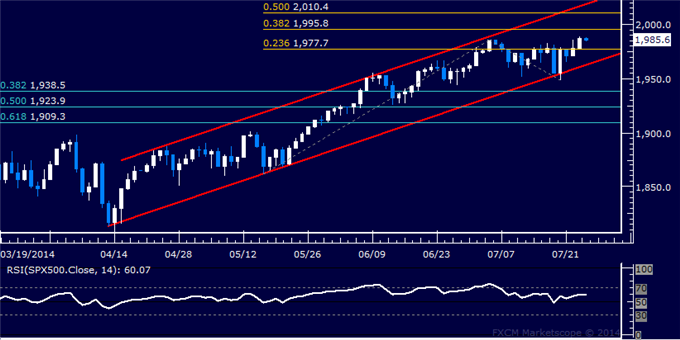
Prices resumed their move upward to set a new record high. Near-term resistance is at 1995.80, the 38.2% Fibonacci expansion, with a break above that on a daily closing basis exposing the 50% level at 2010.40. Alternatively, a reversal below the 23.6% Fib at 1977.70 aims for the bottom of a rising channel set from mid-April, now at 1962.80.
If the S&P 500 can take out 2000, it will punctuate a rise from the 1000 mark that took 16 years. It first crossed 1000 on Feb. 2, 1998, when the market was in the final years of the longest bull market in history. After taking 4,790 days to get from 1500 to 1600, thanks to the market crash in the year 2000 following the collapse of the tech-stock bubble, the S&P 500 has blown through 1700, 1800 and 1900 in 14 months.
2000 is a big milestone worth celebrating, just like man’s first step on the moon and Dow 10,000 back in 1999 . But it will also increase talk of a market top.


 Trading Guide")
