
Technical Pattern Analysis for the coming week: EURUSD, GBPUSD, AUDUSD, NZDUSD, USDJPY, USDCAD and USDCHF
27 October 2014, 06:11

0
274
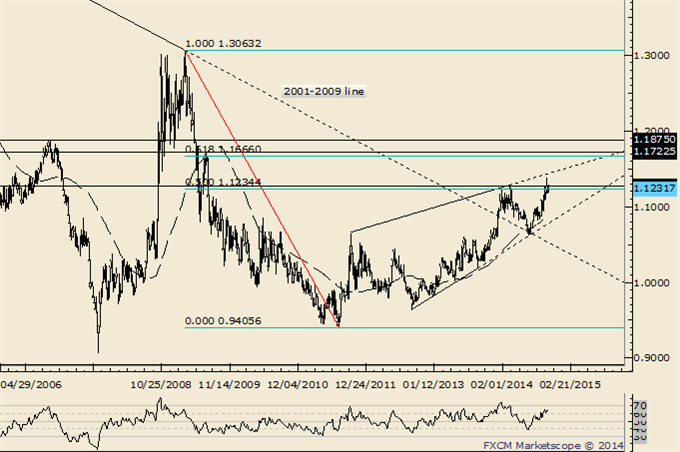
EUR/USD
Weekly
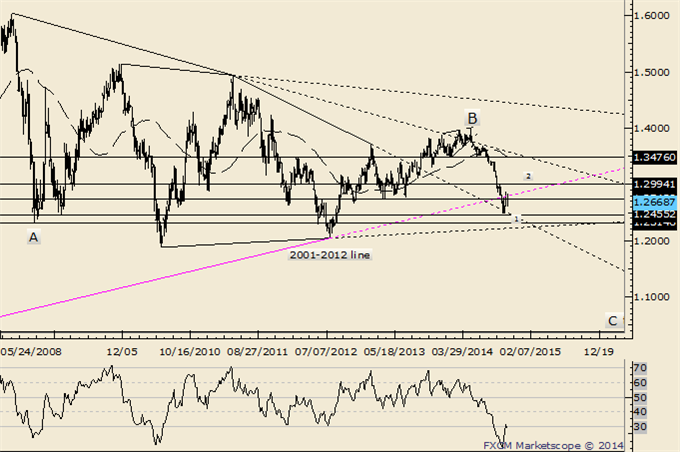
- BIG picture, monthly RSI has broken out of a triangle pattern. Sometimes, a pattern breakout in momentum (or OBV) precedes the breakout in price. The development’s implications are obviously significant.
- Near term, price action since the October low likely composes a 4th wave correction within a 5 wave decline from the May high.
GBP/USD
Weekly
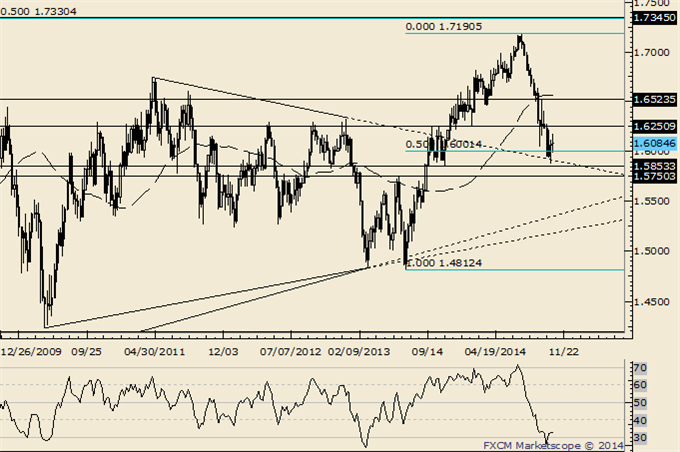
- GBPUSD is at a crossroads. The trend is down against 1.6184 but recent activity warns of a turn. The rate carved a key reversal last week and action since the low is constructive (decline from 1.6184 found low at the 61.8% of prior rally).
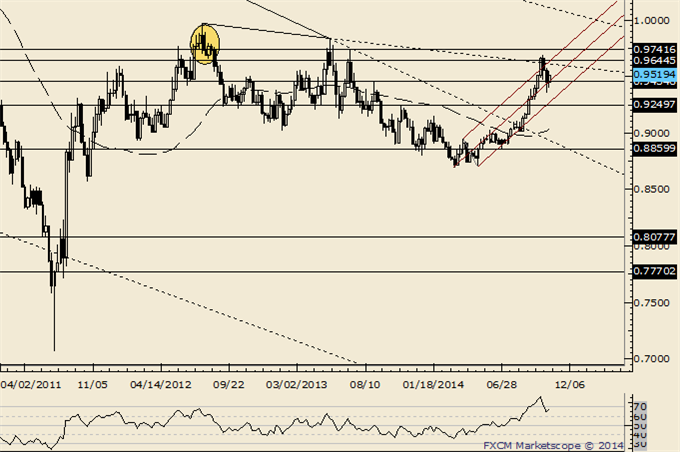
AUD/USD
Weekly
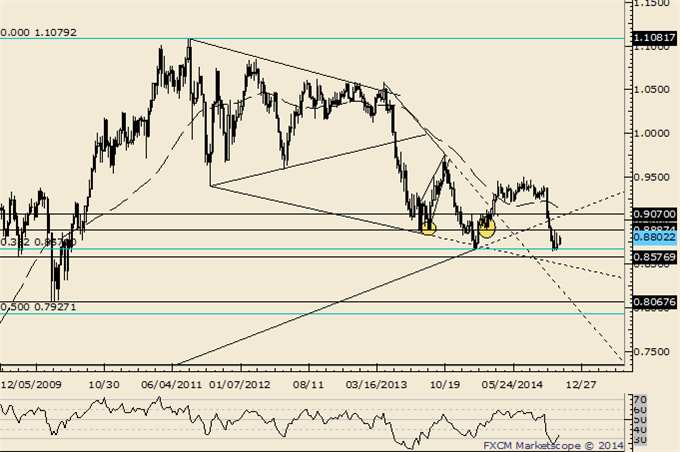
- “The combination of the .9400 figure and weekly RSI failing near 60 indicates a lot of overhead to punch through. Since the 2011 top, each RSI failure near 60 has led to a top or topping process (range for several weeks then a breakdown...that may be the case now).”
- AUDUSD broke down from a head and shoulders top on 9/9. The target was reached 4 days after the pattern completed.
NZD/USD
Weekly
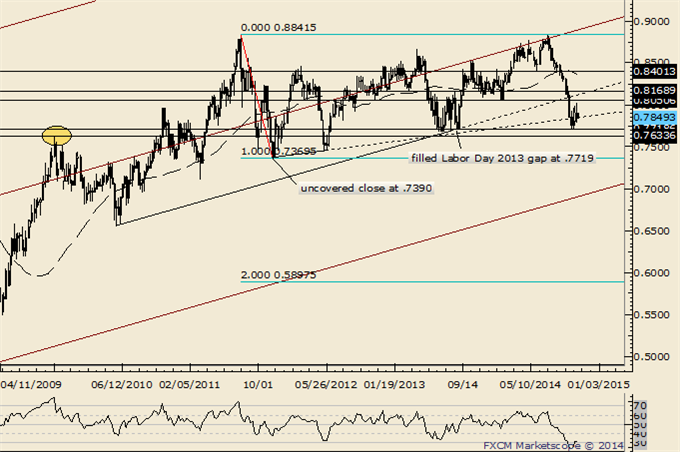
- “Don’t forget about the line that extends off of the 1996 and 2007 highs. That line crosses through the 2008, 2011, and highs as well. In 2011 (record free float high), the rate surged through the line in late July before topping on August 1st. The rate reversed this week from pips below the record high and above the mentioned line.”
- The gap from Labor Day 2013 has held as support but this week’s spike
into .8034 (just shy of the February low at .8050) probably completed 3
weeks of consolidation.
USD/JPY
Weekly
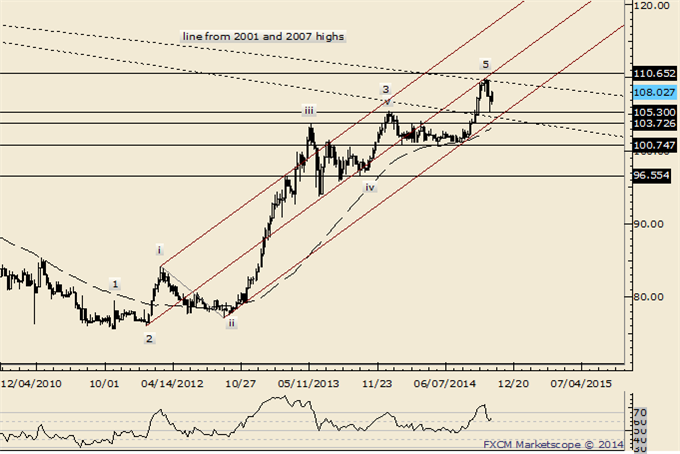
- “5 waves up from the 2011 low are counted which raises the risk of a sharp reversal lower from the trendline that extends off of the 2001 and 2007 highs. 106.80 and 105.40 are reaction levels (support).”
USD/CAD
Weekly
- USDCAD traded to its best levels since July 2009 this week but finished in the middle of its range for the week. The close and weak momentum profile casts doubt regarding the validity of the breakout but continue to look higher as long as price is above 1.1080.
USD/CHF
Weekly
- “USDCHF weakness has reset the market for another rally attempt. Remember, USDCHF broke above the trendline that extends off of the 2001 and 2010 highs. Like EURUSD, USDCHF monthly RSI broke from a potentially long term basing pattern.


")