Discussion of article "Universal RSI indicator for working in two directions simultaneously"
Hello.
I am just starting to learn MQL, I am very interested in your indicator. Could you explain what files should be placed in the terminal to make the indicator work? ???
Pardon me for a delicate question, but you have a lot of them attached.
Hello.
I am just starting to learn MQL, I am very interested in your indicator. Could you explain what files should be placed in the terminal to make the indicator work? ???
Pardon me for the delicate question, but you have a lot of them attached.
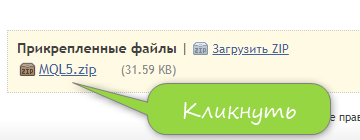
There is an archive attached at the end of the article, you need to download MQL5.zip.
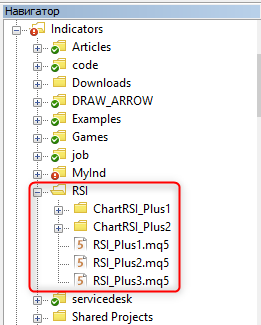
Unpack the downloaded archive. After that, go to the unpacked folder and copy the "Indicators" folder. From MetaEditor menu "File" -> "Open Data Catalogue". In the opened catalogue go to the MQL5 folder. Now just press "Ctrl "+"V" - so the "Indicators" folder from the unpacked archive will be placed on top of the folder with indicators in the data catalogue. After that, you will be able to see the added indicators from the article in the MetaEditor:
Excellent article. The author explained in detail all the stages of implementing the idea of a new indicator.
The article will be useful for developers (trading strategies and indicators) with different degrees of programming skills.
HI
After installing 4th and 5th updates in indicator folder I am not seeing the indicators on navigator,can you suggest where should I install?
Thanks for your effort and nice indicator you provided here.
finally I see 4 different signs on the chart, two green and red dots and 2 green and red arrows and 4 different lines two green and red dotted lines and two green and red solid ones.
How can I get true signal to buy and sell and close my positions based on above mentioned arrows, dots and lines?
Thanks in advance for your reply
Regards
Amir
hi dude
still waiting for your instruction.
thanks
It looks interesting but when I compile it in the latest version MT5 I get 70 errors!
Can you help and check if this is still working in latest version of MT5, please?

- Free trading apps
- Over 8,000 signals for copying
- Economic news for exploring financial markets
You agree to website policy and terms of use
New article Universal RSI indicator for working in two directions simultaneously has been published:
When developing trading algorithms, we often encounter a problem: how to determine where a trend/flat begins and ends? In this article, we try to create a universal indicator, in which we try to combine signals for different types of strategies. We will try to simplify the process of obtaining trade signals in an expert as much as possible. An example of combining several indicators in one will be given.
In this form, the indicator shows the entry points, as well as the points for increasing the position volume. In addition, it is possible to obtain the index of the current signal in the continuous series it belongs to. And since there are also price levels, it is possible to obtain the distance the price has moved from the last signal from the previous series. A more complex trading algorithm can be implemented as well. For example, when opening positions by trend, they can be closed partially or fully based on the signals designed for working in a flat.
Figure 15 demonstrates the indicator operation on the chart. All this is only the result of running RSI.
Fig. 15. The universal RSI indicator.
Author: Anatoli Kazharski