

Chart Synchronization in MQL5 (Part 2): Building an Interactive Multi-Chart Tool
 103
 0

Introduction
Part 1 introduced a simple problem: synchronizing multiple MQL5 charts to the same point in time, even across different timeframes.
The first implementation demonstrated the basic idea. A time value was selected on one chart, converted into the appropriate bar position on each target chart, and the charts were navigated to the corresponding location. This established the core principle of the synchronization system:
Time should be used as the common reference between charts, not bar index.
However, the prototype was still limited. Synchronization could be triggered, but the user had no practical way to interact with the synchronized point after it was created. A useful charting tool needs more than one-time navigation. Users should be able to create a visible reference point, move it on the chart, and propagate updates to other charts. The same interaction should also be available for price levels.
This leads to the next stage of the project.
In Part 2, the prototype is developed into an interactive multi-chart synchronization indicator. Pressing V creates or removes a vertical synchronization line based on the current chart's visible time. Pressing H does the same for a horizontal line representing the current visible price. Once created, these lines can be dragged to update the corresponding reference across eligible charts.
The implementation is designed to synchronize charts of the same symbol, even when they use different timeframes. For time synchronization, the indicator converts the selected time into the corresponding bar on each chart and uses chart navigation to position it near the center of the visible area. Price synchronization, in contrast, propagates the selected price level without changing each chart's vertical scale.
An important part of the interaction model is event handling. A chart must have an instance of the indicator installed to process keyboard shortcuts and object-drag events originating from that chart. However, a single instance can update the synchronization objects on other eligible charts, even if those charts do not have the indicator installed.
This part continues the Part 1 approach. We start with a working prototype, identify limitations, make design decisions, implement the required functionality, and review the results.
The goal is to provide a practical interaction model for multiple MQL5 charts, keep the implementation understandable, and prepare for the more robust architecture in Part 3.
From Prototype to Interactive Synchronization
The prototype developed in Part 1 demonstrated how multiple charts can be synchronized by using time as a common reference. Once a selected time is converted into the corresponding bar position on each chart, the charts can be navigated to approximately the same point in time, even when they use different timeframes.
However, the prototype was intentionally minimal. Synchronization was initiated by a fixed action and focused only on positioning the charts around a selected time. After synchronization, the user had no direct visual control over the reference point and no way to change it interactively.
For practical multi-timeframe analysis, this interaction is important. A trader may want to move the reference point to another candle, compare a specific price level across several charts, or temporarily stop and restart synchronization without removing the indicator.
This leads to a different design approach for Part 2. Instead of treating synchronization as a one-time operation, the reference point is represented by a visible chart object that the user can interact with.
The indicator introduces two independent synchronization functions:
- Time synchronization — controlled by the V key and represented by a vertical line.
- Price synchronization — controlled by the H key and represented by a horizontal line.
In the current implementation, there are no separate variables to track whether these functions are enabled. Instead, the presence or absence of the corresponding synchronization object on the current chart determines the action of the keyboard shortcut. If the object exists, pressing its shortcut removes the synchronization lines. If it does not exist, the indicator creates the lines and applies the selected reference to eligible charts.
Both functions use a similar interaction workflow, but their behavior is not identical. Time synchronization propagates a common time reference and attempts to position that time near the center of each chart. Price synchronization propagates a selected price level through a horizontal line without changing the chart's vertical scale.
This design also expands the role of OnChartEvent(). In Part 1, chart events were primarily used to detect a keyboard command. In Part 2, the event handler becomes the main interaction layer, responding to both keyboard input and object-drag events.
A chart must have an instance of the indicator installed to process keyboard shortcuts and drag events originating from that chart. However, a single instance can create, update, and remove synchronization objects on other open charts of the same symbol. This allows one chart to act as the control chart, while other charts display the synchronized reference.
The result is an interactive workflow in which users can create a synchronization reference, view it across eligible charts, and move it directly when their analysis requires a different time or price.
Handling User Interaction
The interactive behavior of the indicator starts with OnChartEvent(). Instead of continuously checking the chart state, the indicator waits for specific user actions and responds when a relevant event occurs.
The first event we need is CHARTEVENT_KEYDOWN. It allows the indicator to react when the user presses a key while the chart has focus and an instance of the indicator is installed on that chart.
The following block handles the two keyboard shortcuts:
//--- Handle keyboard shortcuts
   if(id == CHARTEVENT_KEYDOWN)
     {
      int key = (int)lparam;

      //--- Toggle vertical time synchronization with V
      if(key == 'V' || key == 'v')
        {
         if(ObjectFind(0, syncLineName) >= 0)
           {
            Del_Chart_lines(syncLineName);
            ChartRedraw();
           }
         else
           {
            datetime mid_time = GetMiddleVisibleTime(0);
            SyncCharts_V(mid_time);
           }
        }

      //--- Toggle horizontal price synchronization with H
      if(key == 'H' || key == 'h')
        {
         if(ObjectFind(0, horLineName) >= 0)
           {
            Del_Chart_lines(horLineName);
            ChartRedraw();
           }
         else
           {
            double mid_price = GetMiddleVisiblePrice(0);
            SyncCharts_H(mid_price);
           }
        }
     }
The event type is identified through the id parameter. When CHARTEVENT_KEYDOWN is received, the pressed key is available through lparam, which is converted to an integer and stored in key.
The V and H shortcuts are handled independently. The vertical synchronization uses syncLineName, while the horizontal synchronization uses horLineName. This allows the two functions to operate independently and simultaneously.
Each key acts as a toggle. Before starting a synchronization operation, the code checks whether the corresponding object exists on the current chart by calling ObjectFind(). If the object exists, the indicator removes the synchronization line from eligible charts by calling Del_Chart_lines(). If it does not exist, the indicator calculates a new reference point and starts synchronization.
For the V key, GetMiddleVisibleTime() returns the time corresponding to the approximate center of the current chart view. That time is then passed to SyncCharts_V(), which handles the synchronization across eligible charts.
The H key follows the same general pattern, but uses GetMiddleVisiblePrice() to obtain the midpoint of the visible price range before calling SyncCharts_H().
In this implementation, the presence or absence of the synchronization object acts as a local state indicator. ObjectFind() checks only the current chart; it does not verify the state of the other charts or maintain a centralized synchronization state. This keeps the current implementation simple, while leaving centralized state management for Part 3.
This structure gives OnChartEvent() a clear responsibility: detect the user's action and trigger the appropriate operation. The functions responsible for calculating reference values, creating chart objects, and synchronizing multiple charts remain separate.
This separation becomes particularly useful as the indicator grows. The event handler does not need to know how synchronization is performed; it only needs to determine which operation the user requested.
Synchronizing Time and Price Across Charts
Once a user action has been detected by OnChartEvent(), the actual synchronization is performed by dedicated functions. Part 2 uses two separate functions: SyncCharts_V() for time synchronization and SyncCharts_H() for price synchronization.
Both functions follow the same general architecture: iterate through the open charts, select those using the same symbol, create or update the corresponding synchronization object, and refresh the chart when necessary.
The time synchronization function is implemented as follows:
//+------------------------------------------------------------------+
//| Synchronize the selected time across eligible charts             |
//+------------------------------------------------------------------+
void SyncCharts_V(datetime lineTime)
  {
   long chart_id = ChartFirst();

//--- Iterate through all open charts
   while(chart_id >= 0)
     {
      //--- Process only charts with the selected symbol
      if(ChartSymbol(chart_id) == _Symbol)
        {
         //--- Create the synchronization line if needed
         if(ObjectFind(chart_id, syncLineName) < 0)
           {
            ObjectCreate(chart_id, syncLineName, OBJ_VLINE, 0, lineTime, 0);
            ObjectSetInteger(chart_id, syncLineName, OBJPROP_COLOR, clrRed);
            ObjectSetInteger(chart_id, syncLineName, OBJPROP_STYLE, STYLE_DOT);
            ObjectSetInteger(chart_id, syncLineName, OBJPROP_SELECTABLE, true);
            ObjectSetInteger(chart_id, syncLineName, OBJPROP_SELECTED, true);
           }
         else
           {
            //--- Move the existing synchronization line
            ObjectSetInteger(chart_id, syncLineName, OBJPROP_TIME, (long)lineTime);
           }

         //--- Center the chart around the synchronized time
         CenterChartOnTime(chart_id, lineTime);
        }

      //--- Move to the next open chart
      chart_id = ChartNext(chart_id);
     }
  }
The function receives a datetime value rather than a bar index. This continues the principle established in Part 1: time is the common reference between charts, while each chart determines the corresponding bar position according to its own timeframe.
The chart iteration starts with ChartFirst(). MQL5 returns the identifier of the first open chart, and ChartNext() is used to move through the remaining charts. This provides a straightforward way to apply the operation to all currently open charts without maintaining a separate list of chart identifiers.
The synchronization group is limited to charts using the same symbol as the chart where the indicator instance is running. This is a deliberate design decision in Part 2, rather than a configurable option. It keeps the implementation focused on comparing multiple timeframes of the same instrument.
For each eligible chart, ObjectFind() checks whether the synchronization line already exists. If it does not, ObjectCreate() creates an OBJ_VLINE at the requested time. The following properties make the object suitable for interactive use:
It has a distinct appearance, can be selected and dragged.
If the line already exists, the function does not recreate it. Instead, it updates OBJPROP_TIME with the new synchronization time. This allows the same function to handle both the initial creation of the line and subsequent updates when the reference is moved.
After updating the line, CenterChartOnTime() is called for the chart. This separates two responsibilities:
SyncCharts_V() distributes the reference time, while CenterChartOnTime() attempts to position that time near the center of each chart's visible area.
Price synchronization follows a similar structure:
//+------------------------------------------------------------------+
//| Synchronize the selected price across eligible charts            |
//+------------------------------------------------------------------+
void SyncCharts_H(double price)
  {
   long chart_id = ChartFirst();

//--- Iterate through all open charts
   while(chart_id >= 0)
     {
      //--- Process only charts with the selected symbol
      if(ChartSymbol(chart_id) == _Symbol)
        {
         //--- Create the synchronization line if needed
         if(ObjectFind(chart_id, horLineName) < 0)
           {
            ObjectCreate(chart_id, horLineName, OBJ_HLINE, 0, 0, price);
            ObjectSetInteger(chart_id, horLineName, OBJPROP_COLOR, clrRed);
            ObjectSetInteger(chart_id, horLineName, OBJPROP_STYLE, STYLE_DOT);
            ObjectSetInteger(chart_id, horLineName, OBJPROP_SELECTABLE, true);
            ObjectSetInteger(chart_id, horLineName, OBJPROP_SELECTED, true);
           }
         else
           {
            //--- Move the existing synchronization line
            ObjectSetDouble(chart_id, horLineName, OBJPROP_PRICE, price);
           }

         //--- Refresh the chart after updating the line
         ChartRedraw(chart_id);
        }

      //--- Move to the next open chart
      chart_id = ChartNext(chart_id);
     }
  }
Here, the reference value is a double price rather than a datetime. The chart object is therefore an OBJ_HLINE, and its position is controlled through OBJPROP_PRICE.
Although the two functions share a similar iteration and object-update pattern, their visual behavior is different. Time synchronization uses a common timestamp and also attempts to navigate each chart so that the corresponding time is near the center of its visible area. Price synchronization only propagates the selected price level through a horizontal line. It does not modify the vertical price scale or guarantee that the line appears at the same visual position on every chart.
Both synchronization functions can be active at the same time. A chart can therefore display a vertical time reference and a horizontal price reference simultaneously, providing a visual framework for comparing multiple timeframes.
Note one detail: commands targeting other charts may be queued by the terminal. The code issues object and chart commands but does not verify completion or success for each operation. More comprehensive error handling and synchronization-state management are left for Part 3.
Keeping the Synchronized Time Near the Chart Center
Synchronizing a time value across several charts is only part of the problem. After the corresponding bar is located on each chart, the user should be able to see the reference time in a consistent and useful position.
This becomes particularly important when charts use different timeframes or have different navigation states. Simply moving a chart to the required bar does not guarantee that the synchronized time will appear near the center of the visible area.
The positioning logic is implemented in CenterChartOnTime(). The function receives a chart ID and the synchronized time, converts that time into the corresponding bar index for the target chart, and calculates a navigation offset intended to place the bar near the center of the visible chart.
//+------------------------------------------------------------------+
//| Center the chart on the specified time                           |
//+------------------------------------------------------------------+
void CenterChartOnTime(long chart_id, datetime setTime)
  {
   string sym = ChartSymbol(chart_id);
   ENUM_TIMEFRAMES tf = (ENUM_TIMEFRAMES)ChartPeriod(chart_id);

   int bar_index = iBarShift(sym, tf, setTime, false);
   if(bar_index < 0)
      return;

//--- Disable automatic chart positioning
   ChartSetInteger(chart_id, CHART_AUTOSCROLL, false);
   ChartSetInteger(chart_id, CHART_SHIFT, false);

//--- Get the chart width in bars
   int width_in_bars = (int)ChartGetInteger(chart_id, CHART_WIDTH_IN_BARS);
   int first_visible = (int)ChartGetInteger(chart_id, CHART_FIRST_VISIBLE_BAR);

//--- Calculate the first bar required to center the target bar
   int desired_first = bar_index + width_in_bars / 2;
   if(desired_first < 0)
      desired_first = 0;

//--- Navigate the chart to the calculated position
   int shift = first_visible - desired_first;
   ChartNavigate(chart_id, CHART_CURRENT_POS, shift);

   ChartRedraw(chart_id);
  }
The first step is to identify the symbol and timeframe of the target chart. The synchronized time is then converted into a local bar index using iBarShift(). This follows the principle established in Part 1: the common reference between charts is a time value, while each chart determines its own corresponding bar position.
The last argument of iBarShift() is exact, and it is set to false. With exact set to false, the function does not require a bar that opens exactly at the requested time. It returns the index of the bar whose period contains that time, which is the nearest bar with an opening time earlier than the requested time. This matters because the charts use different timeframes: a time taken from an M1 bar usually falls inside an H1 bar and rarely matches its opening time. With exact set to true, the call would return -1 in this case, and the chart would not be navigated. As a result, a higher timeframe chart is positioned on the bar that contains the synchronized moment, not on the moment itself. This is one of the reasons why the centering described below is approximate.
If iBarShift() cannot find a suitable bar, the function exits without navigating the chart. Otherwise, the next step is to disable automatic chart positioning:
//--- Disable automatic chart positioning
   ChartSetInteger(chart_id, CHART_AUTOSCROLL, false);
   ChartSetInteger(chart_id, CHART_SHIFT, false);
CHART_AUTOSCROLL can otherwise move the chart toward the latest data, while CHART_SHIFT changes the chart's right-side display arrangement. Disabling both prevents these automatic positioning features from interfering with the navigation operation. They do not, by themselves, center the synchronized time; that is handled by the calculation and navigation that follow.
The function then reads the chart's width in bars and the index of its first visible bar:
//--- Get the chart width in bars
   int width_in_bars = (int)ChartGetInteger(chart_id, CHART_WIDTH_IN_BARS);
   int first_visible = (int)ChartGetInteger(chart_id, CHART_FIRST_VISIBLE_BAR);
Using CHART_WIDTH_IN_BARS allows the calculation to account for the current chart width rather than relying on a fixed offset. This is important because different charts may display different numbers of bars.
The desired position of the first visible bar is calculated from the target bar and half of the chart width:
int desired_first = bar_index + width_in_bars / 2;
This calculation estimates the navigation position required to place the target bar near the center of the visible area. The function then calculates the difference between the current and desired positions and passes it to ChartNavigate():
//--- Navigate the chart to the calculated position
   int shift = first_visible - desired_first;
   ChartNavigate(chart_id, CHART_CURRENT_POS, shift);
Finally, ChartRedraw() requests a chart refresh after the navigation command.
This approach allows the indicator to attempt to position the same synchronized time near the center of charts with different timeframes and different navigation states. However, exact centering is not guaranteed. Available history, chart boundaries, and differences in the chart's current state can affect the final visual position.
The important distinction is that time synchronization involves both propagating a common timestamp and navigating each chart. Price synchronization, by comparison, only updates a horizontal price line and does not adjust the chart's vertical scale.
With the positioning logic in place, the next step is to handle changes initiated directly by the user. By responding to object-drag events, the indicator can use the line's new position as the reference for another synchronization operation.
Interactive Synchronization by Dragging
The keyboard shortcuts introduced earlier create the synchronization reference, but an interactive tool should also allow the user to adjust that reference directly on the chart. Once the synchronization lines are displayed, dragging either line should provide a new reference value that can be propagated to the other eligible charts.
The current implementation does not maintain a separate variable for the previous synchronization time or price. Instead, the synchronization objects themselves provide the current reference values. When a line is dragged, the event handler reads its new position directly from the chart object and passes that value to the corresponding synchronization function.
The two helper functions used to determine the initial reference points remain unchanged. For time synchronization, GetMiddleVisibleTime() identifies a time near the center of the current chart:
//+------------------------------------------------------------------+
//| Get the time at the center of the visible chart area             |
//+------------------------------------------------------------------+
datetime GetMiddleVisibleTime(long chart_id)
  {
//--- Read the visible chart range
   int visible_bars = (int)ChartGetInteger(chart_id, CHART_VISIBLE_BARS);
   int first_visible = (int)ChartGetInteger(chart_id, CHART_FIRST_VISIBLE_BAR);

//--- Calculate the bar located near the visible center
   int mid_bar = first_visible - visible_bars / 2;
   if(mid_bar < 0)
      mid_bar = 0;

//--- Convert the selected bar to its corresponding time
   string sym = ChartSymbol(chart_id);
   ENUM_TIMEFRAMES tf = (ENUM_TIMEFRAMES)ChartPeriod(chart_id);
   return(iTime(sym, tf, mid_bar));
  }
The function reads the number of visible bars and the first visible bar using ChartGetInteger(). It then calculates a bar near the center of the visible area and converts that bar position into a time with iTime().
This function is used when the user presses V. Instead of requiring the user to select a candle first, the indicator uses the current chart view to determine the initial synchronization time.
Price synchronization uses a different helper function because price is continuous rather than bar-based:
//+------------------------------------------------------------------+
//| Get the price at the center of the visible chart area            |
//+------------------------------------------------------------------+
double GetMiddleVisiblePrice(long chart_id)
  {
//--- Read the visible price range
   double price_max = ChartGetDouble(chart_id, CHART_PRICE_MAX, 0);
   double price_min = ChartGetDouble(chart_id, CHART_PRICE_MIN, 0);

//--- Return the midpoint of the visible price range
   return((price_max + price_min) / 2);
  }
GetMiddleVisiblePrice() reads the current visible price range using CHART_PRICE_MAX and CHART_PRICE_MIN, then returns its midpoint. This function is used when the user presses H, providing a natural starting point for horizontal synchronization without requiring additional input. With the initial reference-point functions in place, the indicator can respond to direct manipulation of the synchronization objects.
MQL5 provides CHARTEVENT_OBJECT_DRAG for this purpose. When a user moves a selectable chart object, the indicator receives an object-drag event through OnChartEvent().
The following block handles the vertical synchronization line:
//--- Synchronize charts when the vertical line is moved
   if(id == CHARTEVENT_OBJECT_DRAG && sparam == syncLineName)
     {
      datetime lineTime = (datetime)ObjectGetInteger(0, syncLineName, OBJPROP_TIME);
      if(lineTime > 0)
        {
         SyncCharts_V(lineTime);
        }
     }
The event is first checked against CHARTEVENT_OBJECT_DRAG. The sparam parameter contains the name of the object involved in the event, allowing the indicator to distinguish the synchronization line from other objects on the chart.
After confirming that the dragged object is syncLineName, its current time is read using ObjectGetInteger() and OBJPROP_TIME.
There is no comparison with a previously stored time. The drag event already identifies the current position of the object, so the indicator can use that value directly as the new synchronization reference and call SyncCharts_V().
The horizontal synchronization line follows the same event-driven pattern:
//--- Synchronize charts when the horizontal line is moved
   if(id == CHARTEVENT_OBJECT_DRAG && sparam == horLineName)
     {
      double price = ObjectGetDouble(0, horLineName, OBJPROP_PRICE);
      SyncCharts_H(price);
     }
For the horizontal line, the current value is retrieved with ObjectGetDouble() and OBJPROP_PRICE. The current drag position is then passed directly to SyncCharts_H().
This approach is the same for both reference types: the event provides an updated object position, and that position becomes the next synchronization value. No previous value needs to be stored simply to detect the new position.
An important design detail is that the vertical and horizontal synchronization functions remain independent. Moving the vertical line changes only the synchronized time, while moving the horizontal line changes only the synchronized price. Both reference lines can therefore remain active at the same time.
The complete interaction follows a simple event-driven chain:
User drags the line → CHARTEVENT_OBJECT_DRAG → read the current time or price → call the corresponding synchronization function → update the eligible charts.
A chart must have an instance of the indicator installed to process a drag event originating from that chart. The synchronization function can then propagate the new reference to other open charts of the same symbol.
This is a significant step beyond the original prototype. The synchronization reference is no longer only a value calculated by the program; it becomes a user-controlled chart object whose position can be changed directly.
At this stage, the main interactive functionality of Part 2 is complete. The next step is to combine these components into the complete indicator and examine the behavior, test results, and remaining architectural limitations.
Complete Code
The previous sections introduced the main components of the interactive synchronization system step by step. OnChartEvent() handles user interaction, while SyncCharts_V() and SyncCharts_H() perform time and price synchronization across eligible charts. CenterChartOnTime() is responsible for positioning the synchronized time near the center of each target chart.
Part 2 also introduced GetMiddleVisibleTime() and GetMiddleVisiblePrice(), which determine the initial time and price references from the current chart.
The complete indicator below combines all of these components into a single working implementation:
//+------------------------------------------------------------------+
//| RM Sync Master - Chart Synchronization                           |
//| Copyright 2026, RM Trading Lab                                   |
//| https://www.mql5.com/en/users/rmtradinglab                       |
//+------------------------------------------------------------------+
#property copyright "© 2026 RM Trading Lab"
#property link      "https://www.mql5.com/en/users/rmtradinglab"
#property version   "2.00"

#property strict
#property indicator_chart_window
#property indicator_plots 0

//--- Product identity (Branding)
#define INDICATOR_NAME     "Article Sync Master"
#define INDICATOR_SUBNAME  "Synchronize Multiple Charts"
#define INDICATOR_VERSION  "2.0.0"    // Major.Minor.Patch

//--- Synchronization object names
string   syncLineName = "Sync_Line";
string   horLineName  = "Hor_Line";

//+------------------------------------------------------------------+
//| Initialize the synchronization state                             |
//+------------------------------------------------------------------+
void OnInit()
  {
//--- Retained as a framework for initialization in the following part.
  }

//+------------------------------------------------------------------+
//| Release resources when the indicator is removed                  |
//+------------------------------------------------------------------+
void OnDeinit(const int reason)
  {
//--- Retained as a framework for cleanup in the following part.
  }

//+------------------------------------------------------------------+
//| Indicator calculation is not required for this tool              |
//+------------------------------------------------------------------+
int OnCalculate(const int rates_total,
                const int prev_calculated,
                const datetime &time[],
                const double &open[],
                const double &high[],
                const double &low[],
                const double &close[],
                const long &tick_volume[],
                const long &volume[],
                const int &spread[])
  {
   return(rates_total);
  }

//+------------------------------------------------------------------+
//| Handle keyboard and chart-object events                          |
//+------------------------------------------------------------------+
void OnChartEvent(const int id,
                  const long &lparam,
                  const double &dparam,
                  const string &sparam)
  {
//--- Handle keyboard shortcuts
   if(id == CHARTEVENT_KEYDOWN)
     {
      int key = (int)lparam;

      //--- Toggle vertical time synchronization with V
      if(key == 'V' || key == 'v')
        {
         if(ObjectFind(0, syncLineName) >= 0)
           {
            Del_Chart_lines(syncLineName);
            ChartRedraw();
           }
         else
           {
            datetime mid_time = GetMiddleVisibleTime(0);
            SyncCharts_V(mid_time);
           }
        }

      //--- Toggle horizontal price synchronization with H
      if(key == 'H' || key == 'h')
        {
         if(ObjectFind(0, horLineName) >= 0)
           {
            Del_Chart_lines(horLineName);
            ChartRedraw();
           }
         else
           {
            double mid_price = GetMiddleVisiblePrice(0);
            SyncCharts_H(mid_price);
           }
        }
     }

//--- Synchronize charts when the vertical line is moved
   if(id == CHARTEVENT_OBJECT_DRAG && sparam == syncLineName)
     {
      datetime lineTime = (datetime)ObjectGetInteger(0, syncLineName, OBJPROP_TIME);
      if(lineTime > 0)
        {
         SyncCharts_V(lineTime);
        }
     }

//--- Synchronize charts when the horizontal line is moved
   if(id == CHARTEVENT_OBJECT_DRAG && sparam == horLineName)
     {
      double price = ObjectGetDouble(0, horLineName, OBJPROP_PRICE);
      SyncCharts_H(price);
     }
  }

//+------------------------------------------------------------------+
//| Get the time at the center of the visible chart area             |
//+------------------------------------------------------------------+
datetime GetMiddleVisibleTime(long chart_id)
  {
//--- Read the visible chart range
   int visible_bars = (int)ChartGetInteger(chart_id, CHART_VISIBLE_BARS);
   int first_visible = (int)ChartGetInteger(chart_id, CHART_FIRST_VISIBLE_BAR);

//--- Calculate the bar located near the visible center
   int mid_bar = first_visible - visible_bars / 2;
   if(mid_bar < 0)
      mid_bar = 0;

//--- Convert the selected bar to its corresponding time
   string sym = ChartSymbol(chart_id);
   ENUM_TIMEFRAMES tf = (ENUM_TIMEFRAMES)ChartPeriod(chart_id);
   return(iTime(sym, tf, mid_bar));
  }

//+------------------------------------------------------------------+
//| Get the price at the center of the visible chart area            |
//+------------------------------------------------------------------+
double GetMiddleVisiblePrice(long chart_id)
  {
//--- Read the visible price range
   double price_max = ChartGetDouble(chart_id, CHART_PRICE_MAX, 0);
   double price_min = ChartGetDouble(chart_id, CHART_PRICE_MIN, 0);

//--- Return the midpoint of the visible price range
   return((price_max + price_min) / 2);
  }

//+------------------------------------------------------------------+
//| Synchronize the selected time across eligible charts             |
//+------------------------------------------------------------------+
void SyncCharts_V(datetime lineTime)
  {
   long chart_id = ChartFirst();

//--- Iterate through all open charts
   while(chart_id >= 0)
     {
      //--- Process only charts with the selected symbol
      if(ChartSymbol(chart_id) == _Symbol)
        {
         //--- Create the synchronization line if needed
         if(ObjectFind(chart_id, syncLineName) < 0)
           {
            ObjectCreate(chart_id, syncLineName, OBJ_VLINE, 0, lineTime, 0);
            ObjectSetInteger(chart_id, syncLineName, OBJPROP_COLOR, clrRed);//clrGoldenrod
            ObjectSetInteger(chart_id, syncLineName, OBJPROP_STYLE, STYLE_DOT);
            ObjectSetInteger(chart_id, syncLineName, OBJPROP_SELECTABLE, true);
            ObjectSetInteger(chart_id, syncLineName, OBJPROP_SELECTED, true);
           }
         else
           {
            //--- Move the existing synchronization line
            ObjectSetInteger(chart_id, syncLineName, OBJPROP_TIME, (long)lineTime);
           }

         //--- Center the chart around the synchronized time
         CenterChartOnTime(chart_id, lineTime);
        }

      //--- Move to the next open chart
      chart_id = ChartNext(chart_id);
     }
  }

//+------------------------------------------------------------------+
//| Synchronize the selected price across eligible charts            |
//+------------------------------------------------------------------+
void SyncCharts_H(double price)
  {
   long chart_id = ChartFirst();

//--- Iterate through all open charts
   while(chart_id >= 0)
     {
      //--- Process only charts with the selected symbol
      if(ChartSymbol(chart_id) == _Symbol)
        {
         //--- Create the synchronization line if needed
         if(ObjectFind(chart_id, horLineName) < 0)
           {
            ObjectCreate(chart_id, horLineName, OBJ_HLINE, 0, 0, price);
            ObjectSetInteger(chart_id, horLineName, OBJPROP_COLOR, clrRed);
            ObjectSetInteger(chart_id, horLineName, OBJPROP_STYLE, STYLE_DOT);
            ObjectSetInteger(chart_id, horLineName, OBJPROP_SELECTABLE, true);
            ObjectSetInteger(chart_id, horLineName, OBJPROP_SELECTED, true);
           }
         else
           {
            //--- Move the existing synchronization line
            ObjectSetDouble(chart_id, horLineName, OBJPROP_PRICE, price);
           }

         //--- Refresh the chart after updating the line
         ChartRedraw(chart_id);
        }

      //--- Move to the next open chart
      chart_id = ChartNext(chart_id);
     }
  }

//+------------------------------------------------------------------+
//| Center the chart on the specified time                           |
//+------------------------------------------------------------------+
void CenterChartOnTime(long chart_id, datetime setTime)
  {
   string sym = ChartSymbol(chart_id);
   ENUM_TIMEFRAMES tf = (ENUM_TIMEFRAMES)ChartPeriod(chart_id);

   int bar_index = iBarShift(sym, tf, setTime, false);
   if(bar_index < 0)
      return;

//--- Disable automatic chart positioning
   ChartSetInteger(chart_id, CHART_AUTOSCROLL, false);
   ChartSetInteger(chart_id, CHART_SHIFT, false);

//--- Get the chart width in bars
   int width_in_bars = (int)ChartGetInteger(chart_id, CHART_WIDTH_IN_BARS);
   int first_visible = (int)ChartGetInteger(chart_id, CHART_FIRST_VISIBLE_BAR);

//--- Calculate the first bar required to center the target bar
   int desired_first = bar_index + width_in_bars / 2;
   if(desired_first < 0)
      desired_first = 0;

//--- Navigate the chart to the calculated position
   int shift = first_visible - desired_first;
   ChartNavigate(chart_id, CHART_CURRENT_POS, shift);

   ChartRedraw(chart_id);
  }

//+------------------------------------------------------------------+
//| Delete a synchronization object from eligible charts             |
//+------------------------------------------------------------------+
void Del_Chart_lines(string line_name)
  {
   long chart_id = ChartFirst();

//--- Iterate through all open charts
   while(chart_id >= 0)
     {
      //--- Process only charts with the selected symbol
      if(ChartSymbol(chart_id) == _Symbol)
        {
         //--- Delete the object if it exists
         if(ObjectFind(chart_id, line_name) >= 0)
            ObjectDelete(chart_id, line_name);

         //--- Refresh the chart after deletion
         ChartRedraw(chart_id);
        }

      //--- Move to the next open chart
      chart_id = ChartNext(chart_id);
     }
  }
//+------------------------------------------------------------------+
The OnInit() and OnDeinit() functions are intentionally empty in this version. No persistent synchronization state, timers, indicator buffers, or dynamically allocated resources are required by the current implementation. The synchronization objects are created, updated, and removed directly when the corresponding user actions occur.
This keeps the lifecycle code minimal and allows Part 2 to focus on the interaction and synchronization logic. More complete initialization, cleanup, object ownership, and state-management mechanisms will be introduced in Part 3 as part of the transition to a more robust architecture.
The implementation represents the working state reached at the end of Part 2. It combines keyboard-controlled synchronization, draggable chart objects, multi-chart traversal, time and price synchronization, and visual positioning of the synchronized time in one event-driven indicator.
The current implementation is intentionally compact. OnChartEvent() serves as the main interaction layer, while the synchronization and positioning functions handle the corresponding operations separately. Synchronization is limited to charts using the same symbol, and keyboard or drag events are processed only on charts where an instance of the indicator is installed.
The synchronization objects also provide the current reference values directly, avoiding the need for separate variables to track the previous time or price. This keeps the implementation simple while exposing several architectural limitations that will become important in the next stage.
Part 3 will build on this working implementation by addressing these limitations and introducing a more robust architecture for state management, object ownership, chart lifecycle, and error handling.
Result, Testing, and Remaining Limitations
After completing the interactive synchronization logic, the indicator was tested on multiple charts of the same symbol using different timeframes. The testing focused on the main interaction scenarios introduced in Part 2: creating and removing synchronization objects, dragging the synchronization lines, synchronizing charts with different timeframes, and positioning the synchronized time near the visible center.
Test environment: MetaTrader 5 build 6230 (IC Markets Global), symbol GBPUSD, with three charts open at the same time: M1, M5 and H1. The price history was loaded on all three charts, so the synchronized time was always inside the available data.
The manual test protocol is listed below. Each step states the expected result and the observed result:
- Open the GBPUSD charts M1, M5 and H1 and install the indicator on one of them. Expected: no synchronization lines. Observed: no lines on any chart.
- Press V on the chart with the indicator. Expected: a vertical line appears on all three charts and the target charts move near the same time. Observed: the line appeared on all charts; the position near the center was approximate.
- Press V again. Expected: the vertical line is removed from all charts. Observed: the line was removed from all charts.
- Press H. Expected: a horizontal line appears on all charts at the visible price of the active chart, and the vertical scale does not change. Observed: as expected.
- Press H again. Expected: the horizontal line is removed from all charts. Observed: the line was removed from all charts.
- Press V and drag the vertical line to another candle on the chart with the indicator. Expected: the line on the other charts moves to the same time. Observed: as expected.
- Press H and drag the horizontal line to another price. Expected: the line on the other charts moves to the same price. Observed: as expected.
The tests were performed with the indicator installed on the chart used to generate the keyboard and drag events. The other open charts of the same symbol acted as synchronization targets. This distinction is important because OnChartEvent() processes events only on charts where an instance of the indicator is installed, while the synchronization functions can update objects on other eligible charts.
Creating and Removing Synchronization Objects
The first test verifies the keyboard interface and the creation and removal of the synchronization objects.
When the user presses V, OnChartEvent() checks whether the vertical synchronization line exists on the current chart. If it does not exist, the indicator obtains the current visible time and calls SyncCharts_V(), which creates or updates the vertical synchronization line on the eligible charts.
Pressing V again removes the vertical synchronization line from the current chart and all related charts.
The same interaction was tested independently for price synchronization using the H key. Pressing H creates or updates the horizontal synchronization line using the current visible price, while pressing H again removes it.
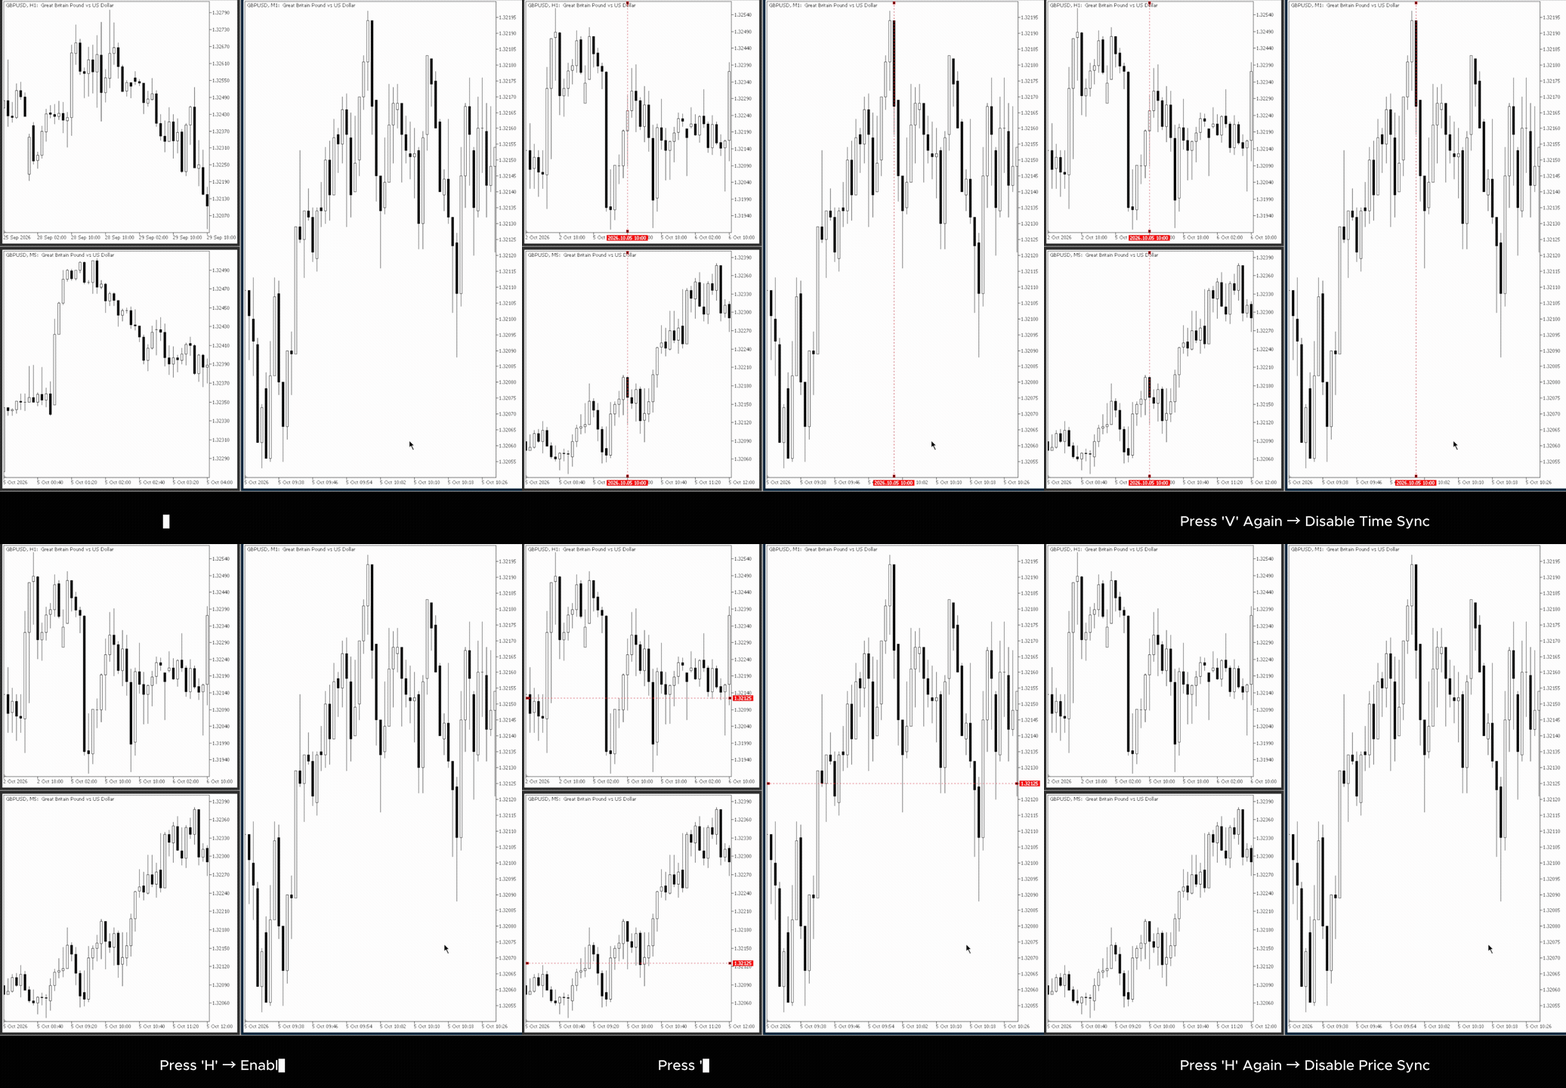
Figure 1. Creating and removing the time and price synchronization lines using the V and H keyboard shortcuts.
The test confirmed that the two synchronization functions can be controlled independently. Both vertical and horizontal synchronization can also remain active at the same time because they use separate chart objects and separate event conditions.
Dragging the Vertical Synchronization Line
The second test verifies interactive time synchronization. After the vertical synchronization line was created, it was dragged to a different candle on the chart containing the indicator. The CHARTEVENT_OBJECT_DRAG event detected the movement, and the new line position was read directly from the chart object.
The resulting time value was then passed to SyncCharts_V(), which updated the vertical synchronization line and chart position on the other eligible charts.
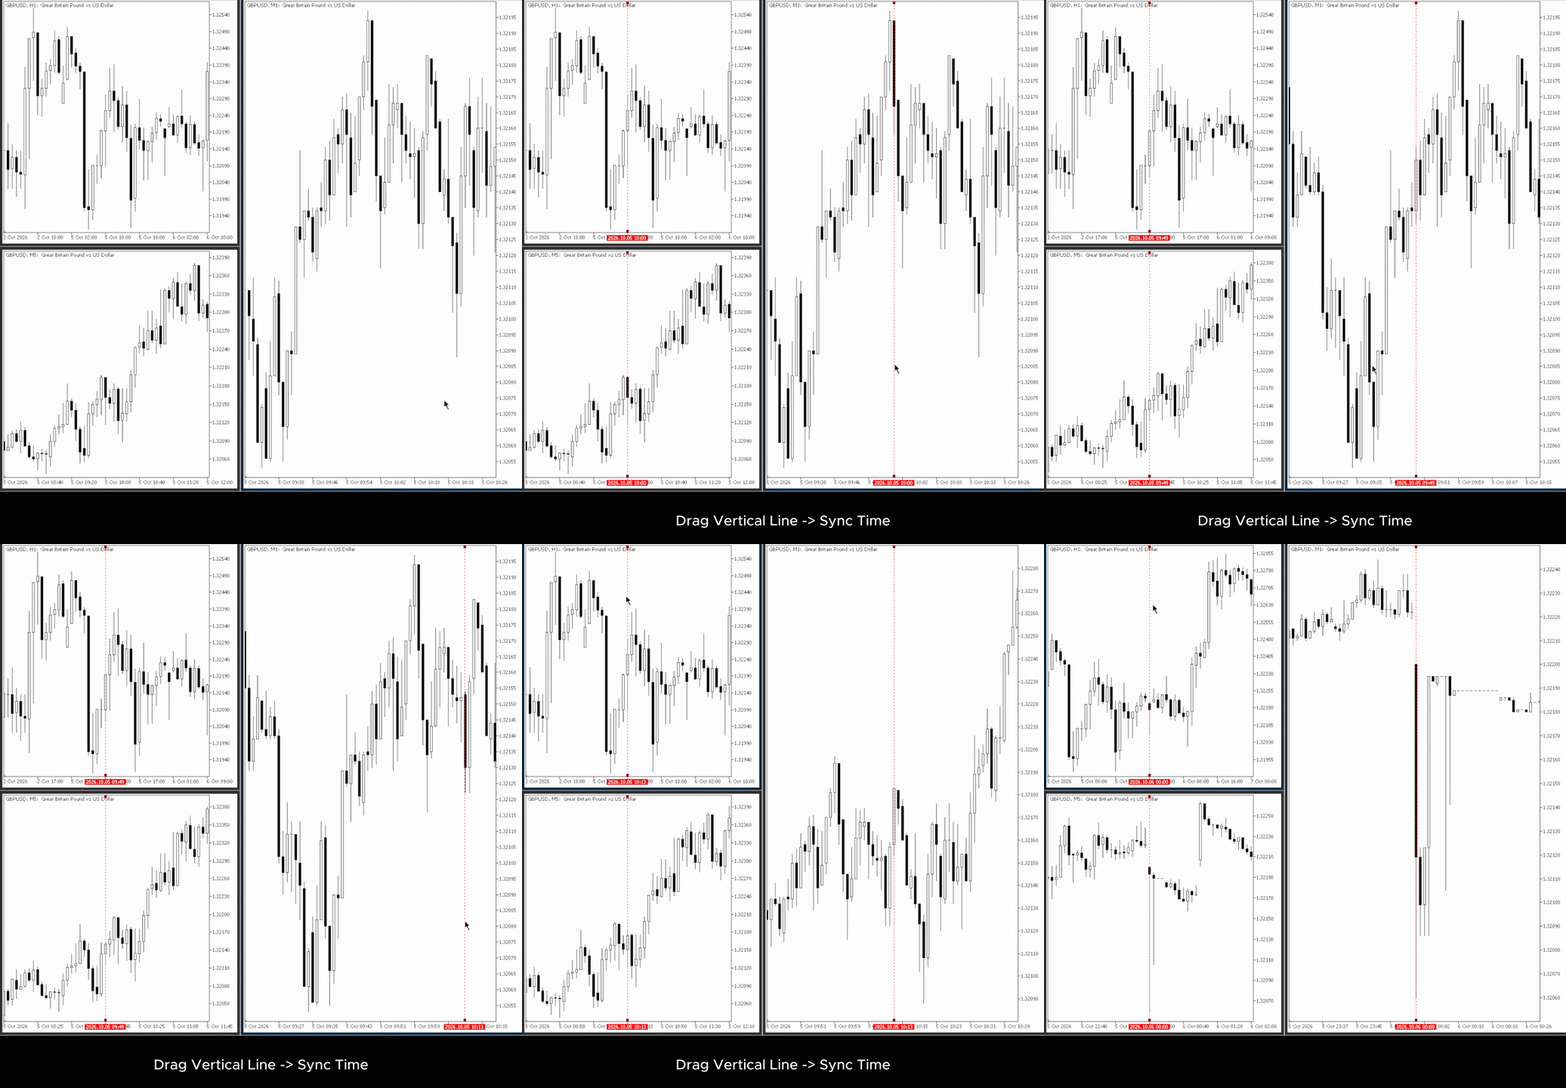
Figure 2. Moving the vertical synchronization line updates the synchronized time across the eligible charts.
The test also demonstrated the multi-timeframe behavior. The same time reference can correspond to different bar positions on different timeframes because iBarShift() maps the selected time to the corresponding bar on each target chart.
This means that synchronization is based on a common time reference rather than a common bar index.
Dragging the Horizontal Synchronization Line
The third test verifies interactive price synchronization. After the horizontal synchronization line was created, it was dragged to a different price level on the chart containing the indicator. The CHARTEVENT_OBJECT_DRAG event detected the movement, and the current price of the line was read directly from the chart object.
The new price was then passed to SyncCharts_H(), which updated the horizontal synchronization line on the other eligible charts.
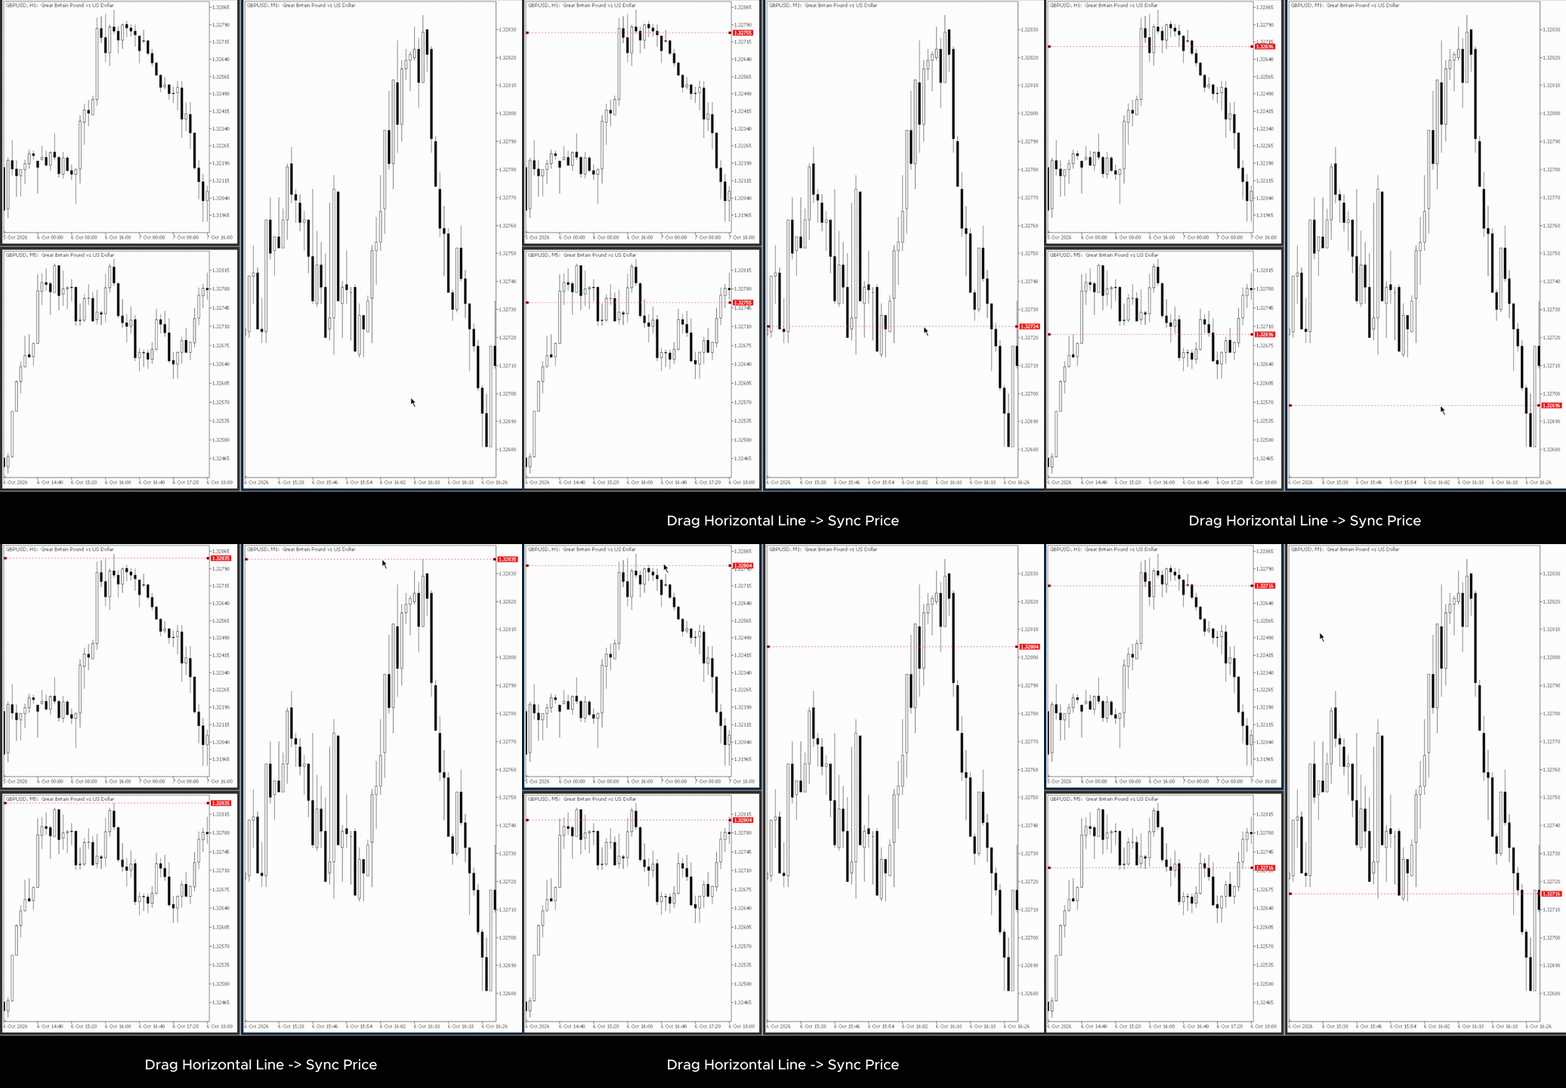
Figure 3. Moving the horizontal synchronization line updates the synchronized price across the eligible charts.
The test confirmed that price synchronization can be adjusted independently of time synchronization. Unlike time synchronization, however, the horizontal line only propagates the selected price level. It does not modify the vertical scale or attempt to place the price at a particular position within the visible chart area.
Test Results
The tested scenarios can be summarized as follows. The Test Conditions column specifies the setup under which each behavior was verified.
| Test | Test Conditions | Expected Result | Result |
|---|---|---|---|
| Press V | Indicator installed on the active chart; multiple same-symbol charts open: M1, M5, and H1 | Create and synchronize the vertical line | Passed |
| Press V again | Vertical synchronization line already exists on the active chart | Remove the vertical synchronization line | Passed |
| Press H | Indicator installed on the active chart; multiple same-symbol charts open: M1, M5, and H1 | Create and synchronize the horizontal line | Passed |
| Press H again | Horizontal synchronization line already exists on the active chart | Remove the horizontal synchronization line | Passed |
| Drag vertical line | Vertical line exists; drag performed on the chart with the indicator installed | Synchronize the new time across eligible charts | Passed |
| Drag horizontal line | Horizontal line exists; drag performed on the chart with the indicator installed | Synchronize the new price across eligible charts | Passed |
| Different timeframes | Same symbol displayed on multiple charts using different timeframes: M1, M5, and H1 | Represent the same time reference at the corresponding bar position | Passed |
| Time positioning | Same symbol displayed on charts with different timeframes and chart widths | Position the synchronized time near the visible center | Passed |
These results cover the main interaction scenarios implemented and tested in Part 2. They demonstrate that the prototype has evolved into a functional interactive synchronization workflow rather than a one-time chart navigation operation.
The results are specific to the test conditions shown above and should not be interpreted as verification of every possible chart state or failure condition. The remaining cases are discussed in the following section.
Remaining Limitations
The current version has a few limitations:
- Changing the timeframe does not automatically restore the synchronized position.
- Keyboard shortcuts and dragging work only on charts with the indicator installed.
- Synchronization relies on chart objects rather than a shared state.
- Newly opened charts are not automatically included.
- Removing the indicator may leave synchronization objects behind.
- Object ownership and operation errors are not fully handled.
- Synchronization works only between charts of the same symbol.
In Part 3, we will improve initialization, cleanup, and synchronization management to make the indicator more reliable.
Conclusion
Part 2 completes the transition from the working prototype developed in Part 1 to a functional interactive multi-chart synchronization indicator.
The resulting implementation provides a practical workflow for creating, removing, and dragging synchronization references for both time and price. Time synchronization uses a common timestamp and attempts to position that reference near the center of each eligible chart, while price synchronization propagates a common price level without changing the chart's vertical scale.
At the same time, the testing phase exposes the boundaries of the current architecture. State is still represented locally through chart objects, object ownership is not explicitly managed, chart lifecycle handling is limited, and operation results are not comprehensively checked.
These limitations provide the foundation for Part 3. The next stage will focus on moving from a compact working implementation toward a more robust architecture for state management, object ownership, chart lifecycle, and error handling.
Warning: All rights to these materials are reserved by MetaQuotes Ltd. Copying or reprinting of these materials in whole or in part is prohibited.
This article was written by a user of the site and reflects their personal views. MetaQuotes Ltd is not responsible for the accuracy of the information presented, nor for any consequences resulting from the use of the solutions, strategies or recommendations described.


