
Meta COT Project - New Horizons for CFTC Report Analysis in MetaTrader 4

Introduction
The market prices movement doesn't caused by the subjective Elliott waves, Gann lines and Fibonacci levels or by technical indicators. Nothing of it does contain any new information bits compared to price chart of OHLCV format. The price movement is determined by fundamental law of supply and demand. No matter how trivial it may seems, but demand and supply determine the price.
The price is a result of buyers' and sellers' interaction. Many traders know about it, but just a few use it. The practical application of this comprehensive market law can be extremely useful for anyone who have ever taken a dare to predict future prices. This article is a kind of "conductor" from theoretical postulates of the economy to its application for trading on the futures and commodity markets.
The economic theory states about the possibility of the existence of the "overbought" and "oversold" phases of the market. These phases are critical to the market. A further upward price movement in "overbought" zone is becoming more difficult because of increasing competition of the supply. Further downward price movement in the "oversold" zone is also becoming increasingly difficult, but because of the increasing pressure of demand. In both cases, the market is close to its long-term reversal. These statements may seem simple and so useless, because of the fact that economic theory has not proposed any methods to determine these market phases. However, these methods exist and, as it often happens, were developed a long time ago by successful traders.
This article is a bridge between the theory and practice, it introduces the reader with the methods of the market phase determination, based on simple indicators, described in the book "Trade Stocks and Commodities With the Insiders: Secrets of the COT Report", written by the famous trader Larry Williams. Nevertheless, the book did not become very popular, and the material didn't become widely used. One of the main reasons for this fact is that all the concepts presented in the book, have remained theoretical.
After more than two years since the Russian translation of the book, there hasn't been proposed any universal, useful, and opened software for the conception use in MetaTrader4, the most popular trading platform in Russia. This article fills this gap. Now anyone can test and use the Larry Williams' theory in practice using their own MetaTrader 4 client terminal.
The method of the current market analysis using the Commitments of Traders Report can be considered as a fundamental analysis. The fundamental analysis itself hasn't found a wide application for the traders. It's no secret that most of traders uses technical analysis for the real trading. This is due to the fact that fundamental analysis is often connected with the economic news release, and its impossible to predict the market reaction on the news.
Secondly, this analysis is non-parameterized, and thus it's very subjective.
The third, the fundamental analysis is potentially endless. It means that you
can analyze just a certain part of the economic effects that can
affect the market, and the other part is always not considered by the trader, but it will be considered by the market. The use of the CFTC
reports automatically eliminates all the weaknesses of the fundamental
analysis, and Larry
Williams's method for these reports analysis gives the best features of technical
analysis to the technology. This means that firstly, all the significant economic effects
can be considered indirectly through observing the actions of three groups of
market participants.
Secondly, all these observations can be reduced to the simple technical indicators, with reducing the subjectivity and ambiguity.
It is possible to create an Expert Advisor that uses the simple fundamental analysis rules for trading. One of such developments is presented here. I think that it can be useful for anyone, who will decide to use the CFTC report for a trading.
The first part of the article is about the economic theory of supply and demand. Using simple examples, the market model is described, the possible existence of the different market phases is proved. The second part is about data analysis methods, which are necessary to determine the current market phase. It includes the descriptions of a set of indicators needed to analyze the interaction of buyers and sellers. It's mostly based on Larry Williams's book, in which the practical use of these indicators has been shown in details. The third part is about the technical implementation of the Meta COT Project. It contains detailed information about the Expert Advisor use, the use of indicators and scripts that are included in the project and how to download necessary information. The fourth part is the final. We will examine the Expert Advisor and the effectiveness of the concept presented in the article. The final conclusions are presented, and some constructive suggestions are proposed.
1. The Market as a Balancing Function of Prices
1.1 The law of supply and demand
Market is an institution or mechanism, that brings together buyers
("demand") and sellers ("suppliers") of particular goods, services or resources. [3]
There is no more precise definition
of the market, than that given above. In fact, the main task of any
open market is bringing together sellers and buyers. The relationship between the buyers and sellers are regulated by
the law of supply and demand. This fundamental law makes stock
prices rise or fall, which in turn allows traders to profit or loss
from the price difference between the future and the present prices. Trader should know the mechanism of the balance changing between the supply and demand, so let's consider the following table [3]:
|
Total supply |
Price per bushel (U.S.) |
Total demand per week |
Surplus (+) or shortage (-) |
|---|---|---|---|
12 000 | 5 | 2 000 | +10 000 |
10 000 | 4 | 4 000 | +6 000 |
7 000 | 3 | 7 000 | 0 |
4 000 | 2 | 11 000 | -7 000 |
1 000 | 1 | 16 000 | -15 000 |
Table 1-1. The Market supply and demand of corn (in thousands of bushels)
Here is the connection between corn sellers and buyers, expressed in terms of its price and delivery volume. Sellers wish to sell their goods as expensive as possible, and buyers wish to buy it as cheap as possible. In this case, at corn cost of $ 5 per bushel, there are many sellers who would like to sell it. Their total supply will be 12 000 bushels. But the seller's problem is that there aren't so many buyers who are ready to buy it at such a high price. There are buyers who are ready to buy only 2 000 bushels at such a high price. The other 10 000 bushels (12 000 - 2 000 = 10 000) remain unfulfilled, causing goods surplus from sellers, and goods shortage from buyers. This price is unable to stay on the market. Many sellers will cut their prices just to get rid of goods surplus and get even smaller, but live money. They will join other sellers who wish to pre-empt his fellow competitors. The competition among sellers will begin, which will decrease prices [3].
Now let's consider the opposite case. At this time we assume that the corn price is very low - $ 1 per bushel. Such corn price will be very attractive for buyers, there are many buyers who wish to buy it. Their total demand is 16 000 bushels. But there would be much less sellers who want to sell at that price. The total supply (sales) amount is just 1 000 bushels, which again will cause goods shortage among the buyers in the amount of 15 000 bushels, and surpluses from sellers. Again, this price is not able to stay on the market. Some of the buyers will buy the corn at a higher price, to get the goods they need. These buyers will join their colleagues and anticipate further growth of the prices and want to be among the first who bought it relatively cheap. The competition among buyers will begin, which will increase the price [3].
To make it clear let's draw the functions of demand and supply on the graph:

Figure 1-2. Demand and Supply as function of the price
We
have considered only the extreme distribution cases between
the demand and supply. In the first case, the price will fall, in the
second case, the price will rise. Both of these cases will be to the certain equilibrium point in which demand will equal supply. At this point
there will be no shortage of goods among buyers, or its surplus from sellers. In our table such point is located at 3 dollars. At
that price, the total supply, as well as total demand will be 7 000
bushels, at this price there will be the equilibrium exchange between the buyers
and sellers with no unsold goods left or no deficit appeared.
In a real life, the supply and demand are changing under the influence of many factors, ranging from the fundamental reasons to random events. In any case, there will be the only one cross point of supply and demand. This point will be the current market price.
Consider an example when the supply will increase at a constant demand (point A-B on the Figure 1-3, a). In this case the price will fall (p1<p2), since the goods will become cheaper and the competition among the sellers will begin. On the other hand, the amount of buyers who want to buy goods at a better price will be more (q3>q2).
Now consider the case when the supply decreases (point A to C at Figure 1-3a). This will cause the higher prices, because there will be less goods and the competition among buyers will begin (p3>p2). Certainly the buyers who want to buy at the higher prices will become less.
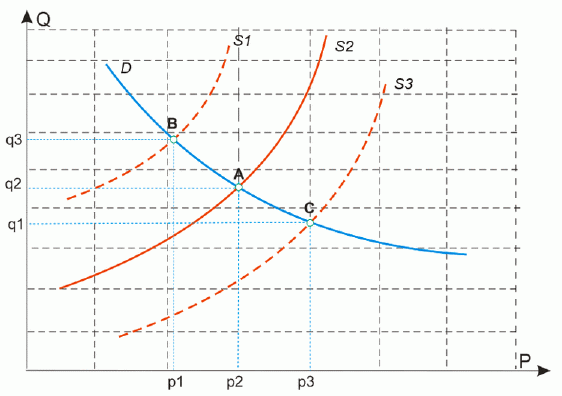
Figure 1-3a. Supply change at a constant demand
The same is true for the demand - when it increases (points A and B at Figure 1-3b), the price starts to rise, and it will be many who want to sell at a higher price, which would result into increased total supply (q3>q2). In the opposite case, when demand begins to fall, the price will fall, sellers wonting to sell at a low price will be less, and thus, the cumulative number of supply will decrease (q1<q2).
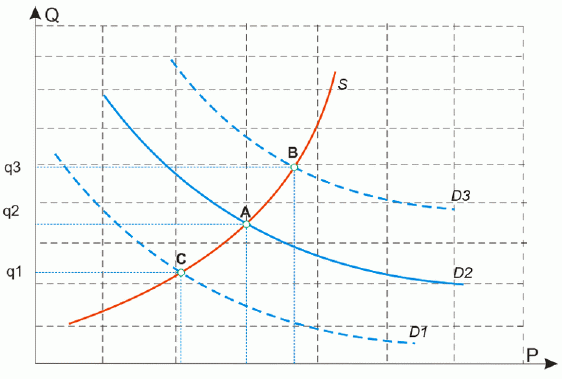
Figure 1-3b. Demand change at a constant supply
Now
let's consider the case where the demand and supply are changing
simultaneously. Is clear that there are only four such cases [3]:
1. The demand decreases, the supply increases. Each of these factors separately leads to the lower prices and, consequently, the total price decline will be even greater than that caused by each of the factors separately.
2. The demand increases, the supply increases. These factors are mutually compensating, since the demand growth leads to the price increase, and the supply growth leads to the price decrease. Generally, the price movement will depend on the stronger factor.
3. The demand decreases, the supply decreases. Just as in the previous case, the result is uncertain. With the demand decrease the price will decline, while the supply decrease leads to the price increase. Generally, the price movement will depend on the stronger factor.
4. The demand increases, the supply decreases. The demand increase leads to the price increase, exactly as the supply decrease leads to the price increase. As a result, the total price increase will be even greater than that caused by each of the factors separately.
On the real market the supply and demand are changing every second, and all these four cases are reflected in the actual market price of the value. Thus, the cross point of supply and demand "walks" on the chart of prices and volume, at different time periods, being in different locations (see Figure 1-4):
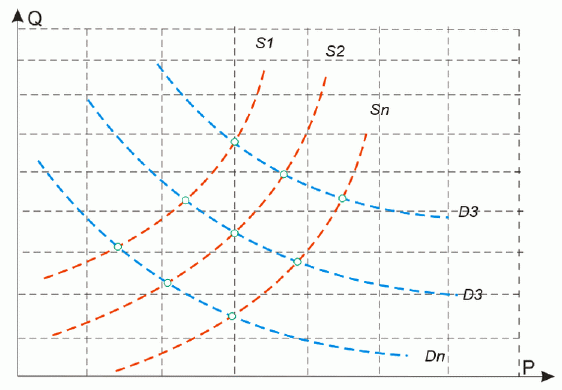
Figure 1-4. The dynamics of demand and supply
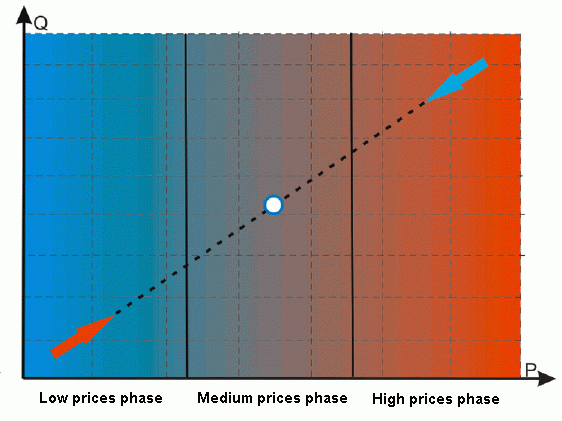
Figure 1-5. The Market Phases
As it has been stated above, the suppliers will refuse to provide a large volume at low prices (to sell a lot and cheap), and the buyers will refuse to provide a high demand at high prices (to buy a lot and expensive). Therefore, it is possible to construct a model of any market. The Figure 1.5 shows a model. The dotted line shows the average cross of the supply and demand. The full market cycle can be divided into three periods or phases:
1. The Low Prices Phase. It is characterized by low volumes at low
price. The real, but unrealized market demand from buyers will be
high, while the market supply will be limited. There is a
goods shortage among the buyers and unrealized goods surplus from
the sellers. It will cause the buyers competition, which will lead ultimately to the price increase.
2. The Average Prices Phase. In this phase there are acceptable prices at sufficiently high volumes. There is no shortage of buyers for both and there is no surplus from the sellers. Here is the equilibrium point for the price and volume [3]. In Figure 1.5 it is presented by dot.
3. The High Prices Phase. It is characterized by high prices (P) with high volumes (Q). The actual supply from the producers of goods will be high, while the buyers demand will be limited. The buyers' reluctance to buy expensive goods and producers' desire to sell expensive goods will cause the producers' competition, which will lead ultimately to the price decrease.
In other words, the law of supply and demand determines the return-and-trending market movement. In the medium term (its time scale is about 1-1,5 years approximately) the market will go from the low prices phase to the high prices phase, or vice versa, so there will be a trend. In the long term (from one year or more) the market will go to the high or low prices phase, meeting with buyers' or sellers' resistance, and under their action will turn backwards, so it will be the flat. The market movement can be compared with the breathing. After a full exhalation it is very difficult to find even just a little air in the lungs, to continue exhalation.
Contrary, the pressure between the diaphragm and lungs is becoming less than atmospheric, and air come to the lungs easy. After the full breath the volume of lungs is completely used and there is no possibility to inhale it still at least a little. At this time the pressure between a diaphragm and lungs becomes more than atmospheric, superfluous pressure tries to push out air from the lungs. This process repeats again and again. The similar processes occurs in the market. The arising buyers' competition (the negative pressure) forces the market to increase prices (to inhale air) while the sellers' competition (the positive pressure) forces the market to decrease prices (to exhale air).
As we have seen above, the goods shortage and oversupply situations are possible at the market. But it is also true that the equal quantity is bought and sold every time on the market. Therefore, the conclusions of some technical analysts that the market is dominated by the bulls, when they see an uptrend or bear when they see a downward trend, are incorrect. The market always has an equal number of bulls (buyers) and bears (sellers) contracts. But, at low prices, there is a limited quantity of goods for sale on the market. The majority of goods owners wait out such periods.
In the other words, if it is wheat, it stays in the storehouse and stays in the bank if it is a currency. Thus, buyers are unable to buy goods in the
quantities they want. Using the standard
terminology this situation can be called as "overbought". The opposite case, where
the prices are high and all of the goods surplus from the sellers are on the
market, may be called as "oversold". Further we will mean it for the overbought and oversold cases.
1.2 The price is the first variable for the demand and supply equation
To illustrate the examples of low and high prices, let's consider the weekly sugar bars:
Figure 1-6. Sugar, weekly bars
We know that at relatively low prices there will be little who want to sell, and thus the goods volume presented on the market is also relatively small. Contrary, at the high market prices the goods volume will be more. The price itself can tell us about the possibility of the oversupply or shortage of goods. However, this assumption is often rude and estimated. Although the goods price and volume are correlated between themselves, there is no direct linear relationship between them.
At relatively high prices there can be a relatively small volume of goods, while at the same time at relatively high volumes there may be relatively cheap prices. This is due to the fact that the functions of supply and demand are rarely linear, almost always they are subject to both price elasticity of demand and price elasticity of supply [5]. The second problem determining the volumes of the market using the prices is the "relativity" of such an approach. How can we determine, what prices are high, and what prices are low?
We know that the market is not counter-trended in the long term, so why not to create an indicator of overbought and oversold states of the market, and using it start to open short positions first, when the market reaches the high prices and to open long positions, when prices are low? The profit must be obtained with a simultaneous use of all of the market properties - when it is trended and when it is counter-trended.
Many technical indicators have been developed during last fifty years, that attempt to determine overbought and
oversold market states. But all of them have one serious problem - the are based on only one variable of the demand and supply, and this variable is price. The change of the price is the
last thing that happens on the market after the change of supply and demand balance.
Consequently, at best, a trader using any indicator, based on the
price or the price itself, will be the last to keep up with the
changing price, but will never be able to preempt it. The simple computer
tests shows the inconsistency of this approach.
Here is a profit chart of the elementary system based on the RSI indicator:
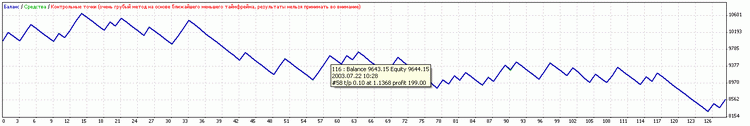
Figure 1-7. The profit dynamics of the Expert Advisor, based on RSI indicator. EURUSD, daily bars, from 2000 to 2009.
The system is elementary. If 7-period RSI reaches 80 percents, it opens a sell deal. If the RSI reaches 20%, then it opens the buy deal.The custom period has chosen to open more deals. The stop is 100 points, and the exist from the trade condition is the profit of 200 points. Testing performed on EURUSD, from 2000 to 2009, the daily bars has used. The trading lot for all of the deals was constant and equal to 0.1.
The conclusions are unambiguous: using the price data only it is not enough to
determine the phase of the market. We need a second variable of the
equation of supply and demand - the market volume.
1.3 The Open Interest is the second variable of the demand and supply equation
It is surprising that for many markets, there is an opportunity to know their volume up to one contract, analyzing the open interest values.
The Open Interest is the number of contracts of the futures and/or options market and uncompensated by deals, delivery, etc. The Open Interest is the sum of all long or short positions [1]. For example, if the sum of all long positions in the market is equal to 1000 contracts, it means that the sum of all short positions in the same market, too, is equal to 1000 contracts and open interest of 1,000 contracts are the same. The formula for the open interest is presented below:
![]()
The buyer and the seller of one futures contract for the wheat will add one unit to the Open Interest value.
It is important to understand the difference between the Open Interest and the market volume. For example during a day 1 000 000 contracts can be traded, but it does not mean that there are goods for 1 000 000 contracts. It may be much smaller, just during the day they passed from hand to hand, increasing the daily volume. At the end of the day, not all of the positions are closed, many of them are rollovered to the next day. The number of open contracts is the Open Interest Indicator. The producers of goods are looking to hedge their risks by buying long futures, thus they give a commitment of the actual delivery of goods. It is reflected in the Open Interest values. Thus, in some sense, the Open Interest could be a measure of the volume of goods on the market.
The Open Interest is calculated daily at the end of each session in all futures markets. This information is open and it is usually available on the official websites of the futures exchanges. The same data on Open Interest can be obtained by subscribing to the paid signals like e-Signal. For the MetaTrader users, the Open Interest data for more than 40 markets can be obtained using the indicator «Meta COT: Net Position», which is part of Meta COT. project presented here. For more information on its using see the third part of the article.
Unfortunately, the information on Open Interest (as well as for all other types of data described in this article) is not available on the spot and stock markets, because of their structure and properties. However, due to the strong correlation between the spot and the futures markets, it becomes possible to trade on the spot, guided by the dynamics of supply and demand on the same futures market. For example, you can analyze the Open Interest dynamics for the EURO futures, but trading on the spot EURUSD. However, for a more accurate representation we will use the futures chart only.
Now let's look at the of Open Interest dynamics for Gold over a long time period:
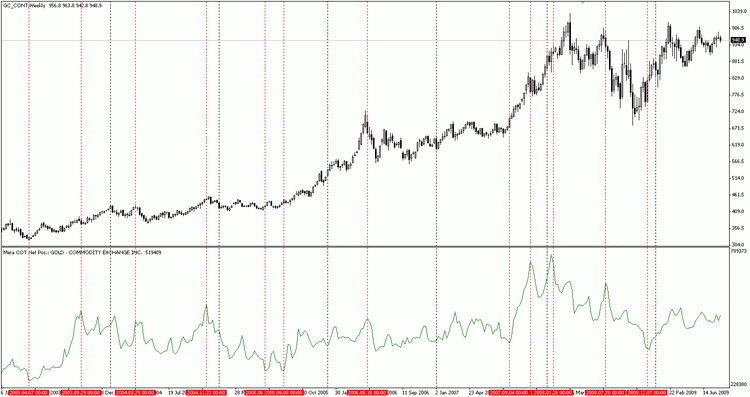
Figure 1-8. Gold, weekly chart
In Figure 1-8 we see the Price chart (upper) and the Open Interest (lower) chart for the futures of Gold from 2003 to 2009. One can see that when the Open Interest values were relatively high as compared with its previous values, the market started to go downward. At the same time, when the Open Interest values were low, the market started to go upward. It isn't seen well on a weekly chart because of the long time period, including a recent high volatility.
What is true for the gold, it is true for any other commodity, the law of supply and demand works on any market:
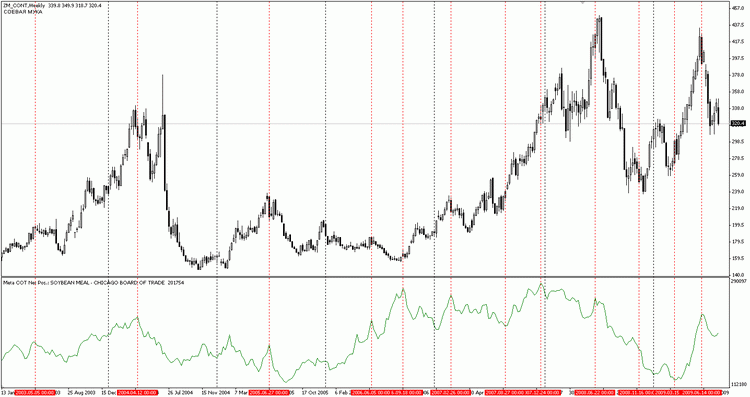
Figure 1-9. Soybean, weekly chart
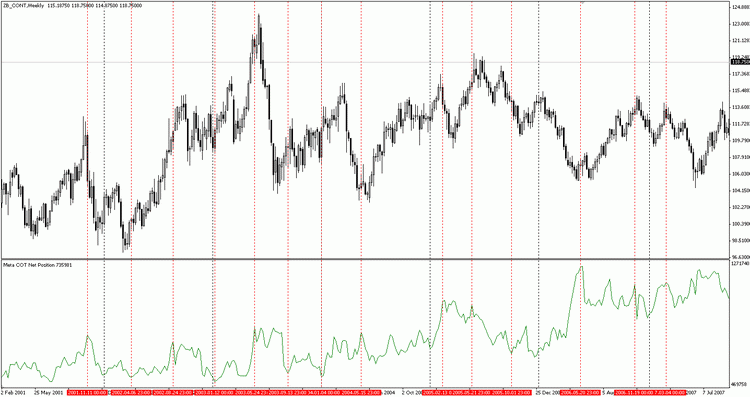
Figure 1-10. US Treasury bonds, weekly chart
As you can see, relatively low values of the Open Interest indicate the potential for the market growth, while relatively high Open Interest values indicate the potential for the prices decline. The market does not always reverse when Open Interest has minimal or maximal values, and the extremal values of Open Interest don't point to an immediate market reversal. The Open Interest is not a magic market "switcher", but it allows to measure the second dimension - the market volume, and estimate the current phase of the market.
Here is the first rule, that can be formulated from the law of supply and demand:
When Open Interest has extremely high levels, try to open short positions.
When Open Interest has extremely low levels, try to open long positions.
2. The Market Structure
We have found that the market - is an institution or mechanism, that brings together buyers and sellers of certain goods and services. Now it is time to consider these groups in details.
2.1 Hedgers and speculators are parts of the market structure.
So, the market always finds the cross point of supply and demand. This point is the consensus price of the goods, i.e., the price at which sellers are ready to sell a certain volume of goods and buyers are ready to buy this volume of goods. Every time the demand and supply is changing under the influence of the fundamental, political, random, and other factors. Based on the law of supply and demand, the price of goods is also changing. Consequently, there is some probability that the future price will be either more or less than the current one. Once the price may change over the time, the price has uncertainty in the future. Such price uncertainty about the price in the future is called a risk [6].
Thus, any owner of goods holds the risk of the adverse price changes in the future. However, the price change may be upward and downward. If the price changes downward it would mean the losses from the sale at a lower price in the future compared to the current market price. Contrary the increase in commodity prices should give the owner an additional profit. Typically the principal owners of goods are their producers.
If the product is wheat, its owner may be the General Mills company, and if it is gold
- its owner can be Barrick Gold Corp, etc. While the high risk of the price changes is high, and the main income of these companies is obtained from the
difference between the cost of their products and the price of its sale, they are interested in reducing the risk that arises in
consequence of the goods owning. To do this, the manufacturers use
hedging operations in commodity and financial markets. In fact,
manufacturers sell their risk to others who want to buy it. As addition to the risk, its buyers have an opportunity to get an additional profit (risk premium) in case of the favorable price changes.
Thus, the exchange is not only a centralized market place. Exchange is also a centralized place for buying and selling risk and premiums for it.
The buyers of goods and the risks attendant to them are called speculators. The main objective of a speculator is to get a profit from the difference between the current and future prices. Speculators are like a "glue" between the manufacturer of the product and its end consumer. They provide a high market liquidity, with a smooth change of the price [4].
The hedging operations are not so much the reduction of risk to zero, it is a way to find the reasonable balance between risk and profit. As you can see further, competent hedging allows the use of an opportunity for speculation. By monitoring hedged positions dynamics it is possible to join the investment group of large manufacturing companies, who know almost everything about the market they work in.
In fact, this viewpoint is not devoid of meaning. These companies are direct goods suppliers, which are traded on the exchange. Who, if not the manufacturer, must know everything that happens in this field of the business? These guys have information hidden from the party eyes and ears, they know that nobody else knows. Or how to explain the fact that for a many decades, they remain successful players on the exchange, performing many millions of dollars daily transactions!
The monitoring
of speculators is also not devoid of meaning. The speculators' buying levels indicates the moments when the market is "overheated", i.e.
it has the third phase, or vice versa, the moments when is it cold (first phase) (see Part
1). In the end, the speculators usually are the main buyers of
the goods, which means that when they built up their long positions to
the maximum, and they no longer have the possibility to buy, the market reverses to downward direction.
2.2 Commodity Futures Trading Commission Reports analysis
Anyone has an opportunity to observe the positions of hedgers and speculators, thanks to the American Government Organization called "Commodity Futures Trading Commission"- CFTC. The fact is that any private or legal person shall submit a report on their committed deals in commodity exchanges, if the volume of these transactions amounts to or exceeds the level specified by the Commission. Once a week the commission reports on the combined positions of traders.
Each report is published on the official website: www.cftc.gov. The report is generated for every Tuesday state and is published on Friday late night, Moscow time. The report itself is presented in several forms: Excel table, CSV text file format, as well as a simple tabular text. Also you can download the history records for a long time period in the Excel and CSV formats. Reports are prepared for both futures deals and futures and option deals. The reports have a brief and extended form. The extended form differs from the brief by existence of the additional statistics and data on crop yields for some crops. In practice, the Excel or CSV files used for the CFTC report analysis. Now let's look at a brief report on wheat for August 4, 2009:
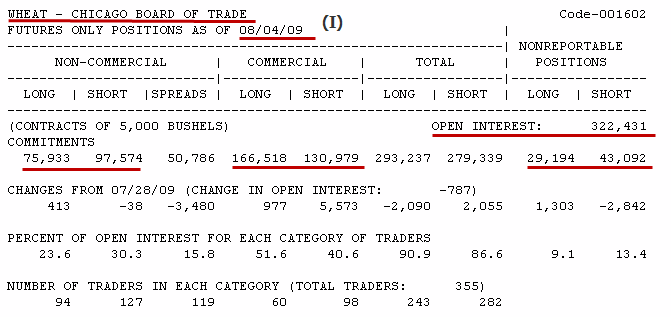
Table 2-1. The wheat report of 04.08.2009 (futures only)
At the top of the report there is a product name, in this case, it is the wheat traded on the Chicago Board of Trade, the type of report - futures only positions, and the date - August 4, 2009. The matrix consists of four main columns. Each of them represents the combined short and long positions of each of the three groups of traders. The first group of traders includes major speculators. The reports are called non-commercial traders (NON-COMMERCIAL). We can see that on 4 August 2009 the big speculators had 75 933 contracts, while on the short side there were 97 574 contracts. This indicates that their total or net position was short and it was -21 641 contracts. Usually, it is not a typical situation for speculators.
In the most, but not all markets they are pure buyers, that is, their long position is always higher than short. Using only one report for analysis it is impossible to determine whether this situation is typical in this market or not. In any case, you must remember that the most important parameter here is the Net position of the group, but not long or short position separately. This net position is used when calculating the majority of indicators of the traders reports analysis. So, once again: the total or net position is equal to the difference between long and short positions, it can be both positive and negative, that's its formula:
![]()
where NetPosition is a pure or total net position of the traders, i is the category of traders, such as major non-commercial traders or large commercial traders.
The next is the number of major contracts for non-commercial traders which are in the so-called spreads, or coverage.
The Larry Williams writes about it the following: "If a non-commercial trader holds futures contracts on the euro/dollar 2 000 long contracts and 1 500 short contracts, 500 contracts will be included in the "Long" category and 1 500 contracts are "Coverage" [1]. Simply, the coverage shows the number of both long and short contracts.
It is important to note that we do not mean the locking. For example traders can keep one and the same commodity opposed positions in futures contracts for different months of delivery, or have opposed positions on the same commodity in futures and options. In the report, which includes positions on options, such cases are taken into account.
The second group reflects the hedger's positions. They are also called the operators or commercial traders (COMMERCIAL). Typically, but not always, the operators are pure sellers, because most of them are producers of commodities like wheat, gold, or pigs. Commercial traders are also other manufactures who use goods as a base for their products, for example, candy floss or a bread. Typically, but not always, they are sellers, i.e., their contracts are on the short side.
Generally, when prices are dropped to a low level, operators are reducing their sales to minimum, because it is not profitable to sell their goods cheaply. At the same time, operators who are producing their own products, on the contrary, increase their long position. Thus, the net position of operators can be long, and indicators based on the net position of operators will be located in the upper zone.
Let's consider the specific case using the example of our report on wheat. The long side of the operators has 166 518 contracts, while the short side has 130 979 contracts. Their net position is 35 539 contracts, i.e. it is long. Often, this means that the price of goods is at the low level, because operators are selling less than buying. In any case, to determine the exact situation it is necessary to use a chart of their net position for a long time period.
The «Total» column contains a set of long and short positions for the combined commercial and non-commercial traders. It is of no practical interest.
The «Nonreportable Positions» column contains a number of long and short positions of unaccountable traders. In fact, this column reflects the small speculators' position, whose positions are too small to get into the speculators' group. These positions are calculated by synthetic calculation - from the value of open interest (OI) the total long and total short positions of reported traders are subtracted. In our case, the OI is 322 431 contracts, while the long is 279 239 contracts, this means that 29 194 contracts are long side of unaccountable persons (322 431 - 279 239). The same calculation can be performed to the short side: 322 431 - 279 339 = 43 092 contracts.
Here are changes in the number of contracts for each group compared with the previous report. Following is the share of each category in the open interest, and at the bottom of the number of traders in each category. These data are not used in practice.
In addition to the report, as it was mentioned above, there are reports that include the Options position. All options positions are converted into futures equivalent and added directly to the futures positions. The same report on wheat, but option and futures combined positions looks as follows:

Table 2-2. The brief wheat report of 04.08.2009, futures and options
Despite of the different numbers, both types of reports will give similar charts of the position changes dynamics. Nevertheless, it's more preferable to use reports that include information on options positions, as they consider a more complete volume of the market. Take a look at the increased value of the "Spreads" column. Now values in this row are dominated by comparison with the long and short positions for non-commercial traders. This is due to the fact that commercial traders mostly use options to cover their futures positions.
Now let's examine an extended form of the report which includes positions of futures and options on the same wheat:
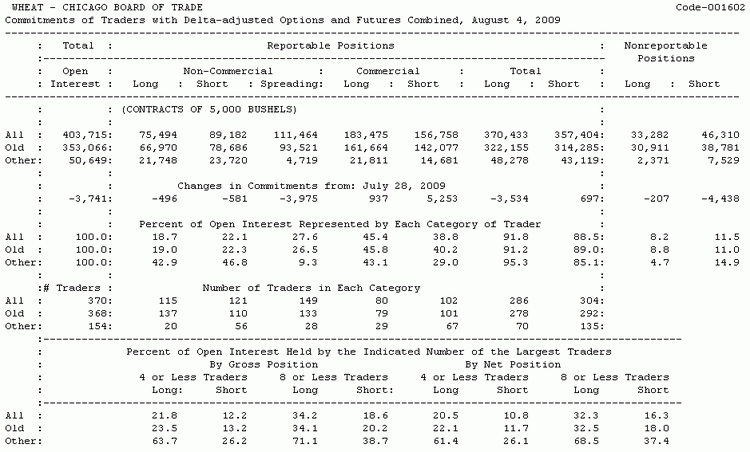
Figure 2-3. The full wheat futures and options report of 04.08.2009
As you can see, the report includes additional statistics on old positions for each of the three groups of traders. Since all of these reports are analyzed in the dynamics over a long time period, this information is of no interest.
2.3 Observing large hedgers' positions
So, it is time to compile statistics on buys and sales of hedgers and monitor their actions for a long time period. For example, we will use the wheat price chart already presented, with the indicator showing the long and short positions of operators. The chart consists of weekly bars and covers the period from the middle of 2001 to the middle of 2009:
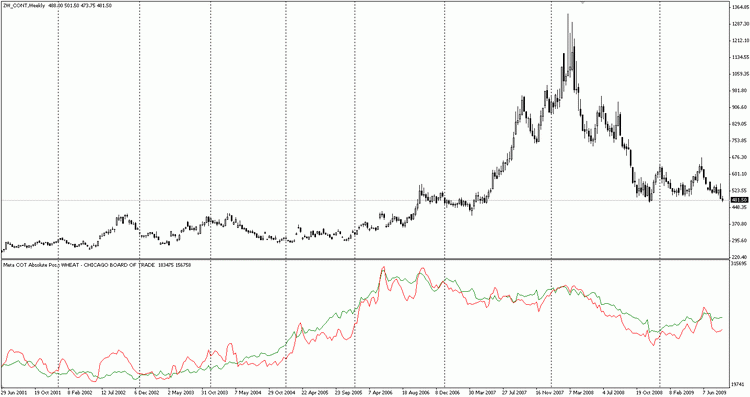
Figure 2-4. Wheat, long an short positions of operators, weekly bars
The green line here shows a long position of operators, the red corresponds to the short positions of operators. All positions are specified in absolute terms, they don't have a sign. It is necessary to assume that the red line represents the absolute amount of short positions, and green - the absolute amount of long positions. In general, short positions of operators dominated until the spring of 2004 (red line above the green), after which the operators had more buys than sells (the green line above the red). Such a chart does not show key break points. Now let's take a look at this same chart, but with an indicator of operators' total net position:
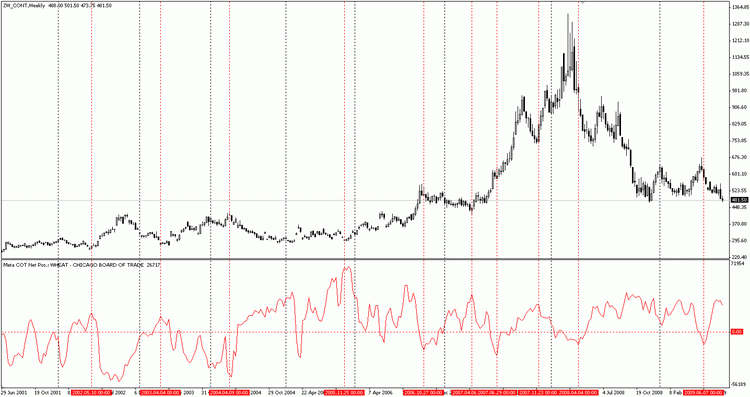
Figure 2-5. Total net positions for the operators, weekly bars
Here you can see more interesting moments. Note that when the net position of operators was relatively high, after some time the market went upward. At the same time, when the net position of operators was relatively low, after some time the market went downward. Of course, not all of the indicator predictions come true, but even if it happened to enter at least one correct point, it would be a huge profit.
Let's pay attention to the extremely high net position of operators in the end of 2005! Never before or after, the operators had such high values of the net position. And now take a look at what happened to the market thereafter. It began the inexorable upward movement, which continued more than 2 years. As a result, the price increased by more than 700 (!) USD. There were some other moments, showing us a good opportunity for speculation.
For example, after a strong price fall at the end of 2007, many might think that the bull trend would finish. Apparently,
the operators didn't think so. While others tried to reduce their long positions (we know it from the traders reports), the operators bought up the market! The rise was soon. A maximal price has been updated, and then the panic has began. During these four months, prices increased by another $400! The sale signals
given by the operators were not so convincing. Nevertheless, in many cases, the trader was able to escape the market safe if he used a simple trailing stop techniques. In any
case, all of the losses could be compensated by one good deal.
The key words here are "shortly thereafter". Do not forget that this
indicator is not calculated by using the price. It is completely independent from
it. We could remove the price chart, but the indicator of net positions
of operators will still be showing the same values. Price is the recent
market changes. The first to change is the balance of supply and
demand forces, and even before that the minds of major market
participants change. Observing that the operators are doing, we are witnessing
the evolution of the market at its early stage, when the price changes
hasn't appeared yet. It gives us a unique advantage to take place in
another half-empty trailer of the future locomotive trend. When the movement begins, many will come too late there, but not the traders using
the commission reports!
Let's observe gold and silver through the prism of operators:
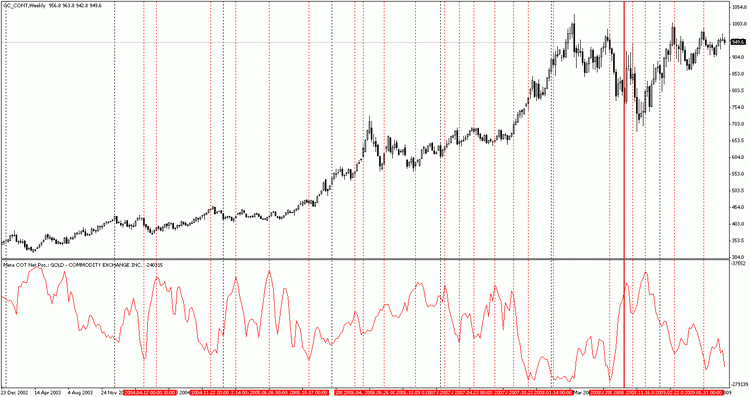
Figure 2-6. The gold and the net position of the operators. Weekly bars
The chart of gold prices is full of favorable opportunities for speculation. Not all of them lead to excess profits, but many of them could bring a substantial income. If a trader correlated his entry points with the main bullish trend that continued for many years, he could be a very big winner. Let me remind you, we are considering the moments when the net position of operators is high enough, these points are potential points for buying. The same applies to sales: we're looking for relatively low levels of net position and trying to short, looking for an opportune moment to sale.
Note the madness that went to gold at the end of 2008. After the strong fall ended in early September, it began an unexpected rise. In fact, during one day the gold price has increased by 90 dollars! Then it was at a high price till the end of September, but it was not very long. Shortly after this there was a new fall, and in the end of October, the gold updated its year's minimum.
Could we predict that shaking at least partially? Yes we could predict it by using the reports on traders positions. Pay attention that not long before the bull Friday (it was the day when the gold's price "suddenly" has increased by $90), operators have stopped to sell the gold.
They are the producers in this market, and all these
years there was not a single week, when the purchase would exceed
the sale. In fact, their refusal of sales brought the panic among
the gold bulls. There was a shortage of metal that moved the prices up.
Although the prices didn't stay on such Olympus for a long time, operators sold some of their metal to gold bulls, who where the last to respond to the price peak. Further the gold price fall has began, after which operators reduced their gold
sales to the four-year minimum (their net position increased (see
chart)). Further we saw the effect of the sellers' competition. The shortage commodity began to rise in price, and this could be a good idea to make money.
Now let's turn to the chart of silver:
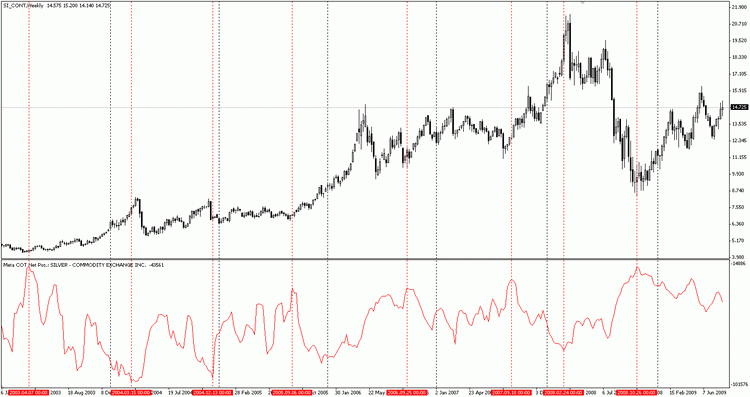
Figure 2-7. The silver and the net position of the operators. Weekly bars
And again we see here the same as for the gold. Whenever the net position reached a relative maximum, the silver price made a new leap to the sun. The relatively low levels were indicating the recession in the uptrend of silver.
The conclusion is the following. The markets of precious metals are largely controlled by a small group of professionals. And any trader who wishes to trade profitably on these markets should take into account the influence of these forces.
2.4 Index of a net position
But how do we know what is the "relatively" high net position, and what is low? As noted by Larry Williams, the floor for one is the ceiling for another. Therefore it is necessary to use the normalized indicator, which would clearly state about the phases of our position. Such an indicator exists, it is called the COT Index. The index is a usual Stochastics calculated for the values of our positions.
Lets recall it's formula [1]:
The current price is compared to the maximal price for three years. The index can be calculated for any time period, not just for three years. It's better to use a period of not less than 26 weeks, i.e. half-year index. In the longer-term deals a 156-week(three-year) index is used. The index shows the relative current strength in percentages, compared with the selected period.
Here is an example of the index calculation for the operators listed below, the digits on the right side indicate the number of contracts [1]:
Current week value | 350 |
Minimal value of last 3 years | -150 |
Difference | 200 |
The maximal value of 3 last years | 750 |
The minimal value of 3 last years | -150 |
Difference | 600 |
Index = (200/600)x100=0,33x100=33%;
In this case the operators are bearish rather than bullish. If the index reaches extremely low levels, i.e. located in the bottom 20% range, the market tends to fall. If the index reaches extremely high levels, i.e. located in the upper 80% range, the market tends to the upward reversal.
To verify this, let's look at the same silver chart, but with 156-week Operators Index:
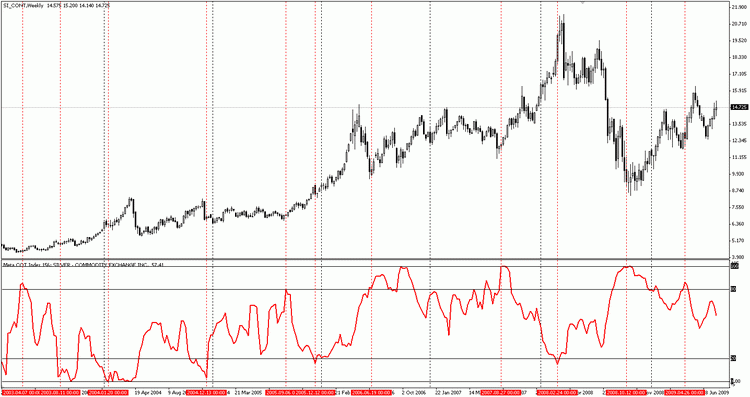
Figure 2-8. Silver and 156-week Operator's Index, weekly bars
You can use other levels, for example 75% and 25%. The meaning will be unchanged, the Indicator will show potential overbought and oversold zones.
Strangely enough, but the period of the index does not change the dynamics of monitored positions. Here is an example of several indexes with different averaging periods for silver:
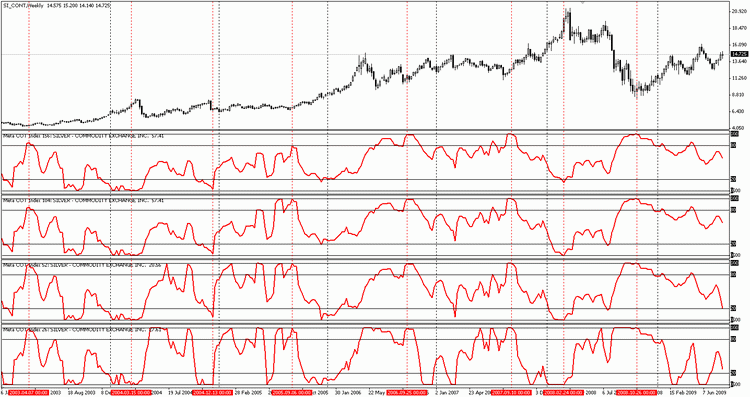
Figure 2-9. Silver chart with different periods for the index of the silver operators, weekly bars
Here we have used (from top to bottom) 156-week, 104-week, 52-week and 26-week averaging for the indexes of the operators. Only 26-week index shows a more frequent movement amplitude. The other periods of averaging look almost similar and don't change the indicator's shape. The averaging period used depends on the personal preferences. For example you can use the 156-week averaging period, it shows the dynamics in positions change rather widely, and at the same time it gives a clear interest result for bullish positions.
The COT index is used to monitor not only the bullish operators, but also for non-commercial traders, as well as small speculators.
2.5 The Open Interest Structure
In
the first part we have analyzed examples of the commodity volume influence on
its price. To measure the volume of goods on the
market, the use of the Open Interest (OI) is a very effective. Economic theory
predicts that the market which characterized by relatively high levels of
the Open Interest is most tends to the downward reversal. The same rule is true for the market with the relatively small values of the Open Interest. In this case, the
price most likely to move upwards.
Now
it's time to investigate its structure. From the traders deal reports we know that the main players on the futures markets are
hedgers, also known as operators, and "non-commercial traders" -
representing mostly large commodity funds. Also there is a third, minor
group of traders - scalper or so-called "crowd". Because of the small
deal volumes performed by them, they are not able to
influence the market prices. The operations volume of
that category is calculated indirectly, and represents the difference
between the Open Interest and the total amount of operator's and non-commercial traders' open positions.
The weekly Open Interest values are presented in the CFTC reports. Since the OI is the cumulative number of opened long and
short positions, as it always is, its level can be calculated in two
ways, by counting the total long position, or by counting the total
short position.
Here are the formulas:
OI = Noncommercial Traders Long + Noncommercial Traders Spreading + Operators Long + Nonreportable Long;
OI = Noncommercial Traders Short + Noncommercial Traders Spreading + Operators Short + Nonreportable Short;
Now
let us turn to the report on the euro futures of the August 4, 2009,
and calculate the open interest for this market by using these two
formulas:
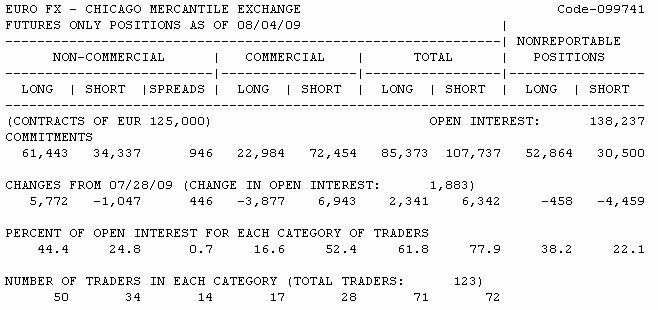
Table 2-10. Euro futures report of 4 August 2009
OI = 61 443 + 946 + 22 984 + 52 864 = 138 237;
OI = 34 337 + 946 + 72 454 + 30 500 = 138 237;
Regardless of the Open Interest calculating formula, the result is the same. However, as you can see, long positions are held mostly by large non-commercial traders (61 337 contracts), while the operators prefer short positions (52 864 contract). Calculation of share of each of these three groups in Open Interest would be a logical continuation of the analysis of the Open Interest structure. For example, the proportion of short position statements in favor of the period amounted to 52,4% of open interest (78 454 / 138,237 x 100%). For example, the share of the operator's short positions for the presented period has made 52,4 % of the Open Interest (78 454 / 138237 x 100 %). Its value is presented in section «Percent of Open Interest for each category of traders».
However it is interesting to consider the share change dynamics of each of three groups of traders. If we collect this information for the long period of time we can construct the corresponding chart. The indicator «Meta Cot: Percent Position in OI». It calculates this data for each of three groups of traders.
The figure
2-14 shows the long-term chart for the Japanese Yen futures. Every time when the share of operators' short position has made 70 % and more of the Open Interest the Ten was close to the downwards reverse. Almost
every time the share of short positions operators was below 30% of open
interest, the market was close to its bottom, and frequently thereafter
began its long-term bullish trends in the movement. Such cases are represented by red dashed line. The same is true for the upwards reversal. Every time when the share of the short position was below 30 % of the Open Interest the Yen was close to the downwards
reversal. Every time when the share of operators' short positions was below 30 % of the Open Interest, the market was close to its bottom, and frequently after that it began the long-term bull trends.
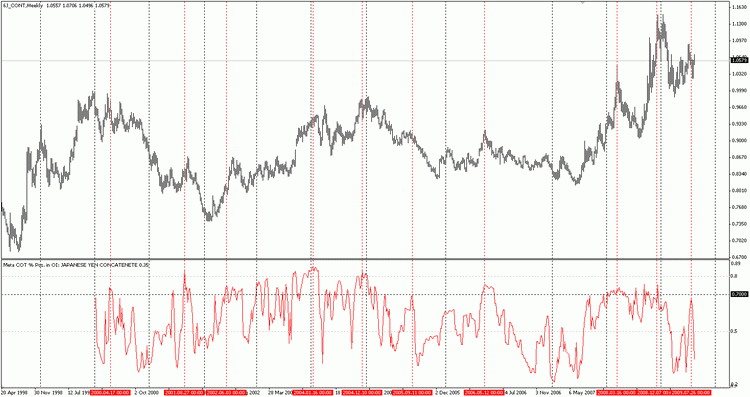
Figure 2-11. Share of the operator's short positions of the Open Interest. Japanese Yen, weekly bars
Larry Williams in his book "Trade Stocks & Commodities with the Insiders: Secrets of the COT Report" [1]
proposes to combine the Open Interest values with the net position of
operators in one indicator. In fact, if the relative net position of
operators is low enough and at the same time, they hold a significant
market share it can be assumed that the market is close to its peak and
soon will turn down.
This indicator is calculated by the formula:
Stochastic Oscillator (Net Operators / OI);
In other words, the net position of operators divides by the Open Interest, these data are collected over a long period of time, the Stochastics indicator calculates using these data. This indicator is called Williams Commercial Index, or simply WILLCO. Larry Williams recommends to use a 26-week or a six-month average, but you can use the other types of averaging, such as the annual (52-week) or three-year (156-week) averages.
Its using is the same as the COT index, whenever its value exceeds 80% - expect the market turns down, whenever its value is below 20% - expect the market reversal up. At figure 2-15 is presented the WILLCO indicator for the Japanese Yen. The red dotted lines show the same levels that were outlines by Larry Williams on that same chart [1]:
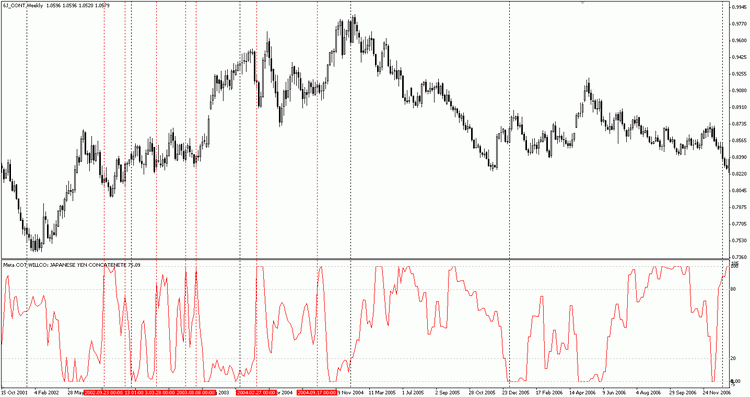
Figure 2-12. The averaged WILLCO (26 weeks) and the Japaneese Yen, weekly bars
As we see, the further recommendations of this indicator were not so accurate. However, the time period increase removes this problem. Take a look at the chart of the U.S. Treasury Bonds and the same indicator, but with a period averaging of 156 weeks:
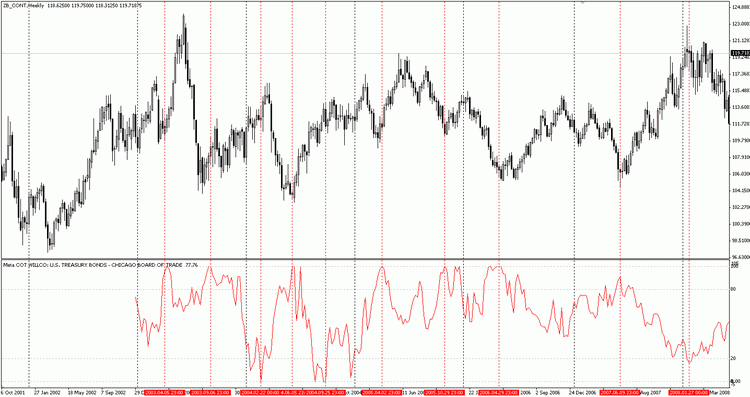
Figure 2-13. Averaged WILLCO (156 week) and U.S. Treasury Bonds, weekly bars
Now we have marked extremal low levels as well as extremal high levels. The indicator accuracy is amazing, because of the fact that its data are not based on the price data! Undoubtedly, the U.S. Treasury notes are very sensitive to the actions of operators.
2.6 Momentum indicator
This indicator was proposed by Stefan Brice, in his book «The Commitments of Traders Bible». Its idea is simple, it represents the difference between the current COT-index and the same index 6 periods ago, so its formula is:
COT-Index (p) – COT-Index(p-n);
Where p is the current value of the index, n is a period equal to 6.
The index delta can be any, and not only
6-period. In addition, the index can be calculated for all participants of the futures market, and even for the Open Interest itself. This indicator
is called the Movement Index. It is mainly
used to confirm for correction completion to the long-term
trends. Its interpretation is simple. If the Movement index rises above 40% -
the current downward movement is coming to finish. The prices rise is expected. If the index falls below 40% - the current upward movement is
coming to finish. The prices decrease is expected.
Let's try to apply this indicator to the futures of euro:
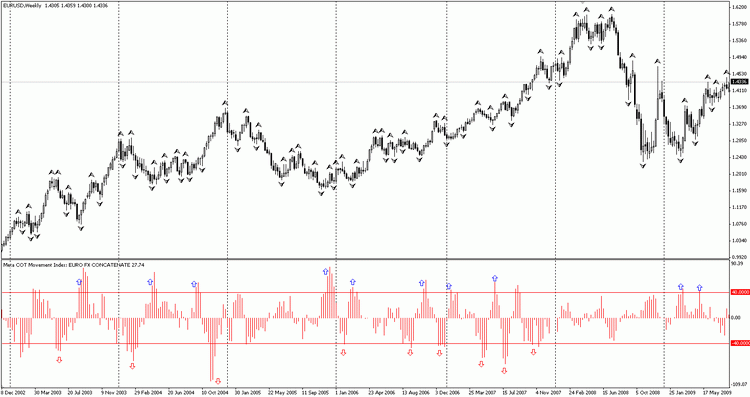
Figure 2-14. Movement Index for EURO futures
Over the past years Euro has a steady upward trend. The blue arrows
showing the times, where it has crossed the 40% barrier. Look to the incredible accuracy of the indicator, each time
after it has crossed the 40% level, the price correction has completed, and the euro has continued its rise. The sale signals of the indicator were not so accurate. However, often the correction has began after the movement
index crossed the lower boundary of -40%. Such indicator reactivity should be taken into account. It's a kind of
COT momentum barometer. It clearly shows the market turbulence. Its use is particularly useful for the aggressive and less
long-term trade.
The next indicator is an experimental and it hasn't described before anywhere. In the ninth chapter of his book Larry Williams explores the Open Interest changes via the action of the operators. It is not clear exactly how to use this relationship. For some examples, Larry Williams shows the divergence/convergence. For the other examples he concludes that the sales increase or operator's buys also increases the level of Open Interest. The investigation of the index movement has led to the idea that it is possible to monitor the changes in the operators positions via the changes of the Open Interest level.
The most interesting interaction models are the following:
1. Open Interest level is falling - the operators net position level is growing.
2. Open Interest level isincreasing - the operators net position level is falling.
In other words, there is a some discrepancy between the actions of all market participants (Open Interest) and the operators actions. Such changes would be best to observe based on the movement index calculated as for Open Interest as for the operators index. Comparing their difference, we can determine the divergence of the hedgers actions and the rest market participants actions.
This indicator was named Spread Movement Index, is its formula:
Movement Index (Operators) – Movement Index (Open Interest);
In
general it looks like simple Movement
Index, as well as WILLCO looks like COT
Index. The approximate critical level values are 60% and -60%
respectively. Its analysis is carried out by the same rules as for the ordinary
movement index.
Lets consider the index behavior on the euro futures example:
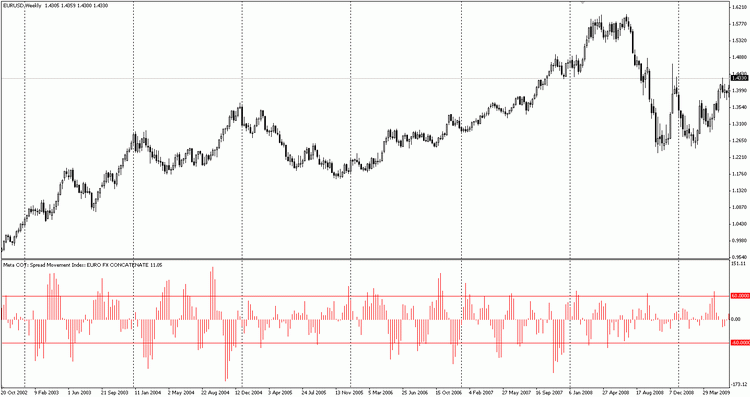
Figure 2-15. Spread Movement Index EURO
One can see that its values also indicates the significant turning points and correction complete moments. However, this indicator should be used with caution - its efficiency hasn't been proved.
2.7. Observing the large hedge fund's positions
The main goal for the large commodity funds is a speculative profits on the commodity markets. The trading methods they used are based on the general trend following. Once the price exceeds a certain n-week high, some of the funds opens long position. It gives an additional upward prices movement. Perhaps one of the main reasons of the market trends in the medium term are the large commodity funds actions.
By some estimates the funds choses 26-week High/Low a most frequently [1]. Funds are in the market gradually, using the technique of building products, besides many of the funds use more long-term strategy for entry. The funds enters on the market gradually, using addition technique for their positions, besides many funds use more long-term strategy for entry. For example, if the price reached its 26-week high, some of the funds are open long positions. Then the price moves further upward and reaches its 52-week high. More cautious funds are join to the game and open long position, together with them the funds already have entered into long are adding to their position. Finally, the price reaches its 156-week high. At this point, who wanted to buy are already have bought. Thats's all. There is no buyers now.
The trend strategies of all of the funds are involved to the maximum. The market became extremely strained. Because of the fact that there are no more buyers, we know it from the traders reports, the price should soon go down ... and soon it does. The price begins its downward movement. At this point the market has an extremely high number of participants (we know it from the Open Interest level), in they are starts to panic.
The first, the buyers who have entered the market later than others starts to close their long positions. They have not yet managed to get a sufficient level of profit that is necessary for long-term position retention. It gives an additional price acceleration and it begins to fall faster. Soon the panic increases and more and more participants are trying to close their long positions. Everyone is trying to squeeze into a doorway. The panic is growing so much that price falls down, during a very short time period.
After the crowd has left the market and the price was at the bottom, just after that the operators start their game and come on the market again, by adding their long positions. Their idea is simple - the operators that use the commodities for production of its goods are interested to buy the goods at cheap prices. Operators, by contrast, reduce their sales to a minimum, is it not profitable to sell goods at low prices. As a result, the net position of operators will be extremely high. Indicators will show this fact accordingly. The demand competition will start, and the price will rise again. The circle closes and history will repeat again.
Let's examine the actions of large non-commercial traders on the basis of the above concepts using the three-year index applied to a non-commercial traders' net positions:
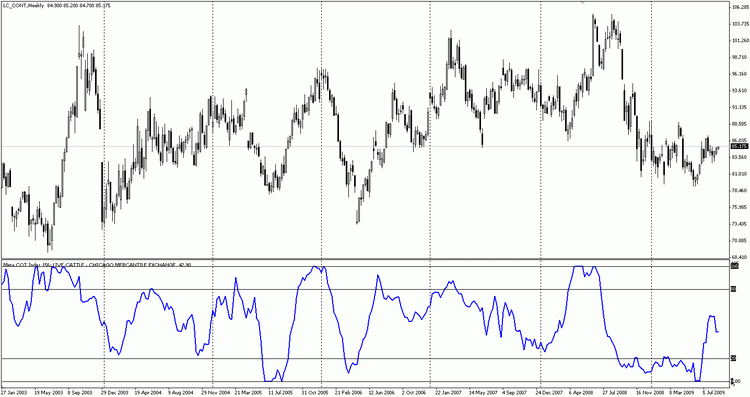
Figure 2-16. Cattle futures price and total net postion of non-commercial traders
As we see on the cattle futures exaple, the actions of the non-commercial traders looks like the current price trend. If the price goes up, the funds are buying, if it goes down, they are sold, it's simple. Let's note that every time when the funds have increased their positions up to maximal values, the cattle price has began it's downward movement. When the
funds position was close to its minimal values, the price has began to rise.
I think that the financial success of the investors, who have decided to invest their money to such funds are under the question. The similar actions of the non-commercial traders are the same on the other markets:
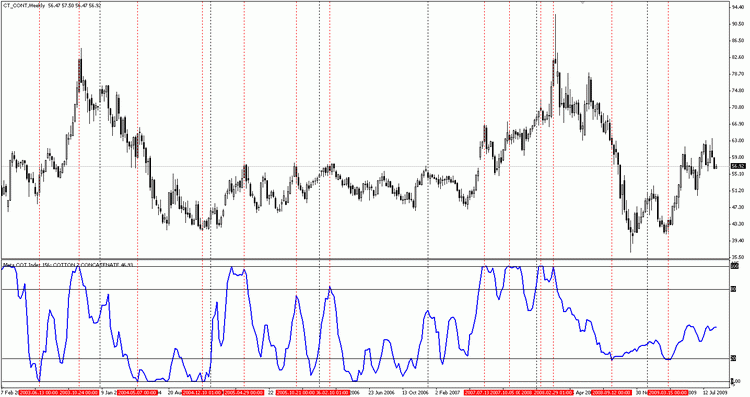
Figure 2-17. Cotton chart and 156-week averaged net position of non-commercial traders
While the index tops clearly shows for the coming market reversal, its low values, as a rule, were premature. In any case, this chart shows that it is better to short when the "big guys" are buying.
2.8 Observing of the small speculator's positions
According to the CFTC specification, the small speculators - all those who have too small positions to reach any of the above two groups. Their exact values are unknown, although it can be assumed that the total number rather impressive. For example, you can apply to a brief report CFTC on wheat on the Chicago Mercantile Exchange:
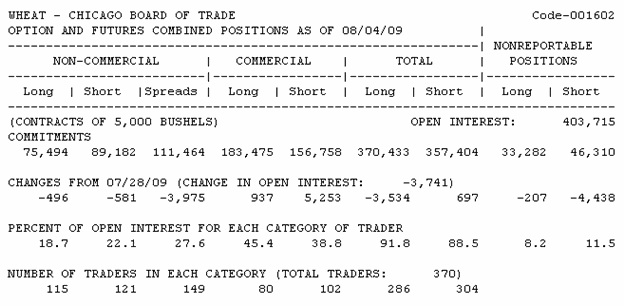
Table 2-18. The share of the small speculators in the brief report on wheat
As we see from the report the total number of major market participants is small. On the short side - 286, on a long - 304. 286 of the market participants holds 91.8% of all long positions and 304 traders has 88.5% of all short positions. Can we call these major market participants as crowd? I think that we can't. But many traders that haven't been counted in the commission report are the very small speculators, creating a market crowd.
In this case, the crowd controls only 8.2% of long positions and 11.5% of short positions. It would be quite remarkable to observe the history of buys and sales of this category of traders. Let us turn to the GBP chart over a long time period, but this time we consider the total net positions of the small speculators:
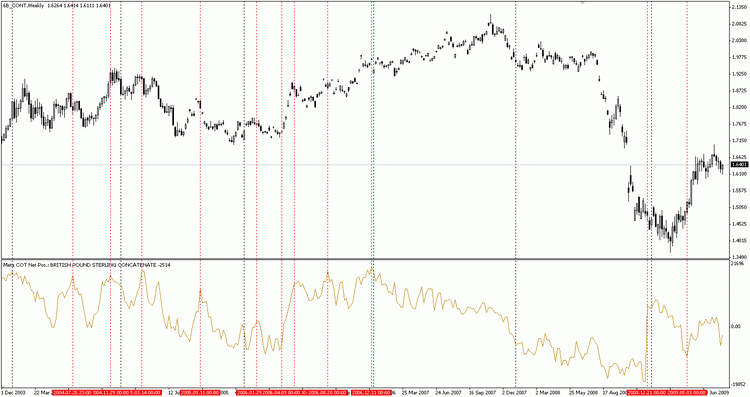
Figure 2-19. Total net position of small speculators on GBP futures
Note that every time when the total net positions of the crowd are reached their relatively high values, the market price hardly began it's downward movement. Conversely, when the crowd were disappointed in GBP and began to sell it, the GBP price began a rally. Particularly noteworthy were the two final points which marked by red lines. After the grand fall of the pound, the small speculators have decided that the bottom has been reached and the upward movement is inevitable. Within one week, they escaped from net sellers to net buyers. However, the bottom hasn't yet been reached. Pound continued to fall about two months. During this time the crowd mood has changed, and it was again mainly sell. And crowd was wrong again. Pound showed a decent rally.
The general rule for the analysis of the trading activities of this group is simple. Try to act contrary to how the crowd. If unaccountable traders sharply increased their sales - try to buy if they are contrary started to buy - try short.
3. Technical solution
3.1 The aim and the structure of MetaCOT project
So, we have considered all of the project indicators, it's time to examine their structure. A clear understanding of their work principles will help you to avoid many problems with the data update and their setting.
The first of all lets consider the principles of the software, here they are:
1. Transperancy. All of the project source code is open and available to everyone. Anybody can download and compile these tools. Moreover, its work principle is described in this article, so it will be transparent and understandable to anyone.
2. Universatility. The software includes all of the CFTC data analysis tools described in the book by Larry Williams, including his
WILLCO indicator, which is absent in any other projects. Moreover, the software includes a special scripts, which groups the information in
a special way. As a result, you can automatically join the different
tools and even create a new ones! In addition, the project architecture is designed for an easy creating of the new indicators based on the COT project. The basic COT data can be obtained (for the date desired) with a single function. And these data can be easily
used to calculate in another indicator.
3. Automation. The CFTC data are extremely large. They contain an information on hundreds of markets, and the each market information is scattered across the different files and years. Using the Meta COT scripts now it will not be a problem. All you need to do now is to download (once a week) the updated file from CFTC and run the script. All of the data will be automatically extracted, grouped and ready to use .
4. Simplicity. All of the indicators and scripts were created using the MQL programming language, without any third-party DLLs. We have used the most simple algorithms for the data organization and calculations. We have used the separation of problems. So the scripts-based programs were developed for the program for group, for unite, for output and for the creation of new data. And these data were used for the indicators construction.
5.
Independence. One of the most important factors in the information obtaining
is the number of its transmitting "nodes". If the
information is transmitted directly from source to destination, the
possibility of its distortion is much less than if there are some additional mediators between the source
and destination. All the project is implemented in a way that the necessary information is taken directly from the source, without a third-party vendors.
The project includes a set of several program files that are not compiled. An each file must be placed in a specific directory and compiled. The following table includes a list of files, their brief description and the installation location:
|
Filename |
Type |
Destination |
Description |
|---|---|---|---|
Meta COT Script Build.mq4 | Script | ..\Meta Trader\experts\scripts\ | The main independent script for data preparation. Creates a set of files from standard CSV-files available on the CFTC.gov server. Each of new file includes an information about instrument. The name fo the created file corresponds to the instrument name. |
Meta COT Script Concatenate.mq4 | Script | ..\Meta Trader\experts\scripts\ | An independent script. It joins a multiple files into one file based on history. For example, the file "COT - SUGAR NO. 11 - NEW YORK BOARD OF TRADE. CSV" (with data for the period 2005.01.04-2007.08.28) and file "COT - SUGAR NO. 11 - ICE FUTURES U.S. .CSV" (with data for the period 2007.09.04-2009.09.01) will be converted into a file "SUGAR CONCATENATE", which includes data from 2005.01.04 to 2009.09.01. |
Meta COT Script Agregation.mq4 | Script | ..\Meta Trader\experts\scripts\ | An independent script. It joins a multiple files into one, based on the summation of their values. For example file "COT - WHEAT - CHICAGO BOARD OF TRADE. CSV", "COT - WHEAT - KANSAS CITY BOARD OF TRADE. CSV", "COT - WHEAT - MINNEAPOLIS GRAIN EXCHANGE. CSV" will be converted into one file "WHEAT AGREGATION" containing the sum of the values of all three files. |
Meta COT Script Report.mq4 | Script | ..\Meta Trader\experts\scripts\ | The script needs a library "cotlib.mq4". It creates a report file CSV, including a calculations for all of the indicators. The averaging periods and instrument name are defined in the script settings. It may be useful for data analysis in other programs. |
Meta COT Absolute Position.mq4 | Indicator | ..\Meta Trader\experts\indicators\ | The script needs a library "cotlib.mq4". It shows the absolute positions of traders in all categories, including an Open Interest. |
Meta COT Net Position.mq4 | Indicator | ..\Meta Trader\experts\indicators\ | The script needs a library "cotlib.mq4". It shows the net positions of traders in all categories, including an Open Interest. |
Meta COT Index.mq4 | Indicator | ..\Meta Trader\experts\indicators\ | The script needs a library "cotlib.mq4". It shows COT index of all categories of traders, including the Open Interest Index. The period for calculation is defined in the script settings. |
Meta COT Percent Position in OI.mq4 | Indicator | ..\Meta Trader\experts\indicators\ | The script needs a library "cotlib.mq4". It shows result of division of net position by Open Interest for each category of traders. |
Meta COT WILLCO.mq4 | Indicator | ..\Meta Trader\experts\indicators\ | The script needs a library "cotlib.mq4". It shows WILLCO index for all categories of traders. The period for calculation is defined in the script settings. |
Meta COT Movement Index.mq4 | Indicator | ..\Meta Trader\experts\indicators\ | The script needs a library "cotlib.mq4". It show the Movement Index and Open Interest for each traders category. The averaging and momentum periods are defined in the script settings. |
Meta COT Spread Movement Index.mq4 | Indicator | ..\Meta Trader\experts\indicators\ | The indicator needs a library "cotlib.mq4" It shows a division of the Movement index by Open Interest for each category of traders. |
Meta COT Expert.mq4 | Expert advisor | ..\Meta Trader\experts\ | An expert advisor needs a library "cotlib.mq4". It is testing COT indicators on historical data. |
cotlib.mq4 | Library | ..\Meta Trader\experts\libraries\ | It's a kernel of system. It includes a COT data and methods for its processing. It has a large set of arrays, definitions and functions for the calculation for all of the indicators used. |
ONCATENATE.ini | File with list | ..\Meta Trader\experts\files\ | It's a file list, with lists to combine by time. |
COT - * CONCATENATE.ini | File lists | ..\Meta Trader\experts\files\ | It's a files with a file lists to combine by time. |
AGREGATION.ini | File with list | ..\Meta Trader\experts\files\ | It's a file list, with lists to combine by summation. |
COT - * AGREGATION.ini | File lists | ..\Meta Trader\experts\files\ | It's a files with a file lists to combine by summation. |
Table 3-1. Meta COT project files with installation paths
You need to install these files in the appropriate directories, and then compile. After these steps, the terminal must receive the appropriate MetaTrader custom indicators, scripts and advisor.
3.2 Loading data and creating reports
As you know, all of the indicators data are provided by a non-commercial organization CFTC. These data are published weekly on the CTFC official website. There are several kinds of reports. The first type is called «Futures Only Reports», it includes only futures positions data. The second type of report is called «Futures-and-Options Combined Reports», it includes the data on futures and options.
It provided much more complete information about the market. It is preferable to use it. Also there is a special kind of report, called
«Commodity Index Trader Supplement». Its main difference is that it is
prepared for the limited range of agricultural markets, and, most
importantly, it includes the fourth traders category, the so-called
Commodity Index Traders (CIT).
These traders are occupies an intermediate position. From the one side their positions belong to the hedgers, they are included in «Futures Only Reports» and «Futures-and-Options Combined Reports», from the other side- their behavior is similar to the behavior of large hedge funds. Generally, they are net buyers, in contrast to classical hedgers, which are net sellers. There is an opinion that this category of traders is making a panic on the market. The sharp falls and rises - are mostly their actions. They have a sufficient power to move the market in any direction, at the same time, their main goal - to get a speculative profit. Data for this category of traders are available from 2007 in Exel and CSV formats. Because of the small history of their actions, the study of their behavior in a task for the future. At present time this kind of report is not supported by the project.
The reports are published in several formats. First, it is the trade tables itself. In this format, there is no report «Commodity Index Trader Supplement», which is available only in the Excel and CSV files.
The form of these tables is familiar to you:

Figure 3-1. The part of COT report in Exсel-format
Also, there are an ordinary Excel tables. They contain the same data as in conventional report, with the only difference being that the data collected over a long period of time. A fragment of this table is shown at Figure 3-2:
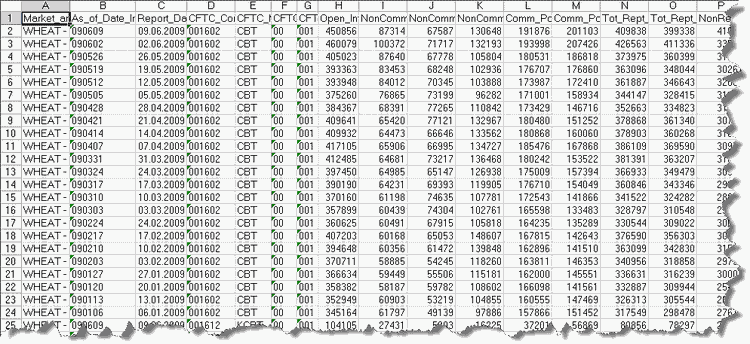
Figure 3-2. A part of the COT report in Exсel-format
The Commission publishes its reports in CSV. This format represents a text file with the «txt» extension, the data are separated by comma. This is the only format, which Meta COT uses, so this format should be described in more detail. At figure 3.4 there is a part from this file:
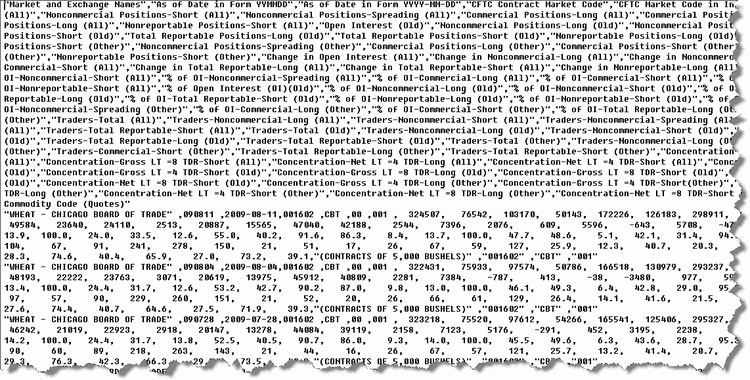
Figure 3-4. COT report example in CSV format
Its structure may seems chaotic, but its not. The file consists of rows and columns. Number of columns is 128, the number of rows depends on the number of instruments and the report period. Typically, a the report file contains data for one year. For example, the report downloaded in this format in September 2009, will contain data from January 2009 to September 2009 (the date of this writing). The first line consists of 128 columns, its a column names. The CSV files are basis for constructing of the project data.
Now lets create a charts. Is convenient to consider the COT data for a long time period. Lets prepare the data from 2000 to the present. So, lets go to the address http://cftc.gov/marketreports/commitmentsoftraders/CFTC009781.html or to the sections Home> Market Reports > Commitments of Traders, at http://cftc.gov.
We will see the picture like the following:
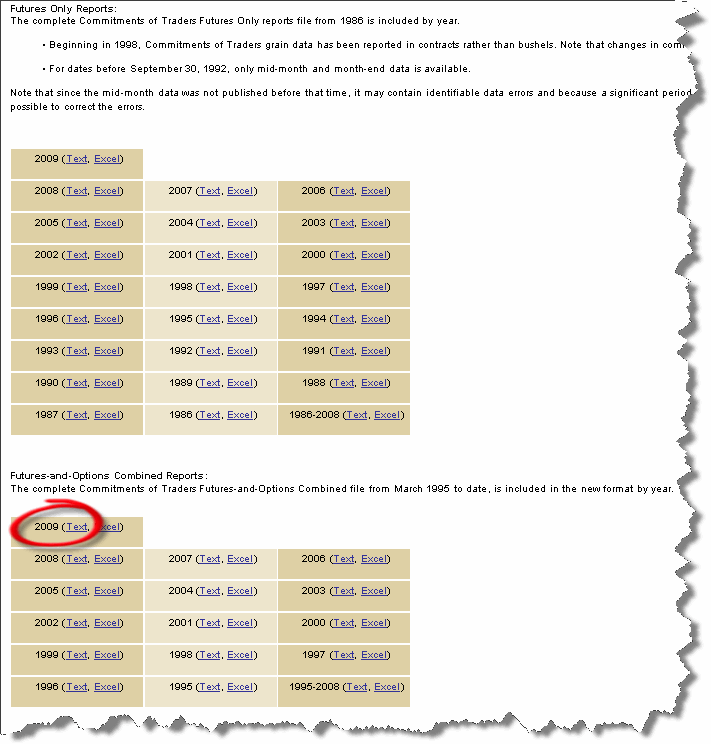
Figure 3-5. Data archive
There are two types of reports: futures only reports and futures and options combined reports. We want to use the data from 2000, it is reasonable to use a second type of report on futures and options (by the way, the data prior to 1995 are available only for futures reports). However, they have the same report formats, and you can use either of these two report types. Download all of the nine text files from 2009 and ending with the year 2000. Later, you can also download a single file which includes all of the data from 1995 to 2008 and one file in 2009, but in such case, there will be a large number of instruments. At Fig. 3.5 one of the references is circled by red circle. Downloaded files should be unpacked in directory ..\ Meta Trader folder \ experts \ files \.
All of the files in the archives have the same name annualof.txt, so they must
be renamed. The file name can anything, but these file names must be
listed in names.ini, its a special configuration file of the project. It is very simple and represents a simple listing of the files to be
processed.
For example, if we have file named "2009_Futures-and-Options.txt" for 2009, "2008_Futures-and-Options.txt" for 2008 and so on, the list of processed files will be as follows:
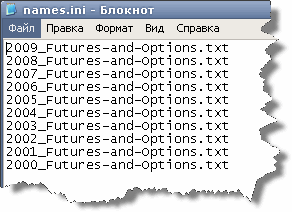
Figure 3-6. An example of processed files list for COT project
If
you rename the downloaded files the same way as in the
example, then you do not have to edit the names.ini file, by default the script will work with this set of files. If, for whatever
reasons, you will need to use other names, then specify the new file names in names.ini, instead of those that are specified by default.
So, in the directory \files you must have 10 files, as shown in Figure 3-6:

Figure 3-7. The contents of the folder MetaTrader\experts\files
The names.ini contents should be same as in Figure 3-6. Note, that file names order in file names.ini is important. The file names should be listed in descending order. For example, the first shoul be a file for 2009, and the last for 2000.
Now, when the data are prepared, it's time to run the Meta COT
Script Build script. It works in automatic mode, and it has an only option - the name of the file list. In this case, the file
name is " names.ini" but it can be changed. It is necessary for flexible solutions to some problems.
Suppose, for example, that for some of the instruments you want to analyse the futures data only, without options data. At the same time for other instruments you want to use a more complete reports on futures and options. You can download two types of reports to your computer and create the two lists of files, for example names_option.ini and names_futures.ini.
First, you can get data on futures by running a script with a parameter "names_list" equal to "names_futures.ini". After that, these data should be saved in another folder. Then, when the necessary data will be obtained by running the script again, but this time with a parameter "names_list" equal "names_option.ini". A data for futures and options will be generated.
Shortly after the script run many files with reports in CSV format in the "\files" folder will be generated. An each such file will have a form like "COT - Market Name - Name of the exchange. CSV".
Many of the files will be incomplete. COT reports on some markets have a feature to appear briefly, then to disappear forever. Nevertheless, there is a sufficient number of instruments, that have a regular reports. Later we will consider, the report instruments included in more detail, but now turn our attention to the files generated. Consider the format using the one of them: "COT - NEW ZEALAND DOLLAR - CHICAGO MERCANTILE EXCHANGE. CSV". It's an easy to guess that it contain an information we need for the New Zealand dollar futures.
Let's open it in notepad and see what inside:
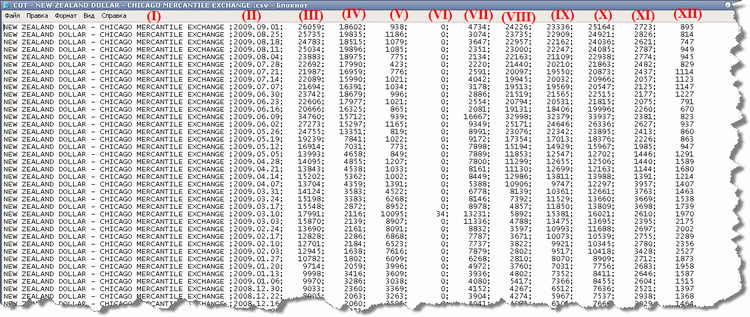
Figure 3-8. New Zealand dollar
One can see, this file contains statistics for a long time period on one instrument, in this case of the New Zealnd dollar. column with names are absent, this file is used for indicators that does not need the column names. Nevertheless, in order to understand what does these numbers means, lets look at each column:
II - Report Date;
III - Open Interest;
IV - Long Positions of non-commercial traders;
V - Short Positions of non-commercial traders;
VI - Spread (Coverage) of non-commercial traders;
VII - Long Position of Operators;
VIII - Short Positions of operators;
IX - The Cumulative number of long positions of the traders reporting;
X - The Cumulative amount of short positions of the traders reporting;
XI - Long Positions of unaccountable traders;
XII - Short Positions of unaccountable traders.
That's all you need to construct the COT indicators.
At this stage the the same markets information are in different files. This is due to the fact that firstly, the names of stock exchanges are changing over time, and secondly, the name itself, the Commission may change the instrument name itself, or even more possible just a mistake in their title. The instrument name change, even one character leads to a significant difference for the program that extracts data.
For example, the instruments "COT - SUGAR NO. 11 - COFFEE SUGAR AND COCOA EXCHANGE" and "COT - SUGAR NO. 11 - COFFEESUGAR AND COCOA EXCHANGE" are completely different to the program, and it will create two different titles for the instruments file. Let's take a look the example of sugar. After running the script Meta COT Script Build a \files directory among many files will have:
COT - SUGAR NO. 11 - COFFEE SUGAR AND COCOA EXCHANGE .csv
COT - SUGAR NO. 11 - COFFEESUGAR AND COCOA EXCHANGE .csv
COT - SUGAR NO. 11 - ICE FUTURES U.S. .csv
COT - SUGAR NO. 11 - NEW YORK BOARD OF TRADE .csv
COT - SUGAR NO. 14 - COFFEE SUGAR AND COCOA EXCHANGE .csv
The
last file belongs to another class of sugar, and contains too little
data, so they can be used, so this file can be immediately removed. As one can see from the name, the first and second files - are corresponds to the same instrument, the Commission some time created a reports on this instrument with
grammatical errors, that influenced for the second file creation. The third and fourth positions contain the files of the same sugar, but
on other exchanges: "ICE FUTURES" and "NEW YORK BOARD OF TRADE".
If you open these files it is possible to identify the chronology of sugar trades:
|
Sugar file name |
Trade begin date |
Trade finish date |
|---|---|---|
COT - SUGAR NO. 11 - ICE FUTURES U.S. .csv | 2007.09.04 | 2009.09.01 |
COT - SUGAR NO. 11 - NEW YORK BOARD OF TRADE .csv
| 2005.01.04 | 2007.08.28 |
COT - SUGAR NO. 11 - COFFEE SUGAR AND COCOA EXCHANGE .csv
| 2003.02.25 | 2004.12.28 |
COT - SUGAR NO. 11 - COFFEESUGAR AND COCOA EXCHANGE .csv
| 2003.01.07 | 2003.02.14 |
Table 3-9. Files with reports on sugar
As it seen from the trades chronology, all data files describes the same product, therefore it is logical to combine all these files into one continuous report file. For that purpose there is a script Meta COT Script Concatenate. The script needs a special file with the enumerations, for example SUGAR CONCATENATE.ini. All of the sugar files that is necessary to join in a single chronology, should be listed there. For his work with the files of sugar to create a special file transfers, such as SUGAR CONCATENATE.ini. It should list all the files of sugar to be combined into a single chronological sequence.
The file name with the file list should be included into the central file list CONCATENATE.ini. This file contains the names of all files, which chronology is necessary to combine. MetaCOT project has corresponding files, they have the following format: COT - NAME TOOL CONCATENATE.ini. These names are listed in the file list CONCATENATE.ini.
After all of the file lists will be prepared, you can run script Meta COT Script Concatenate. After his short run it will create combined files with the same name as the files, but having the format of SCV.
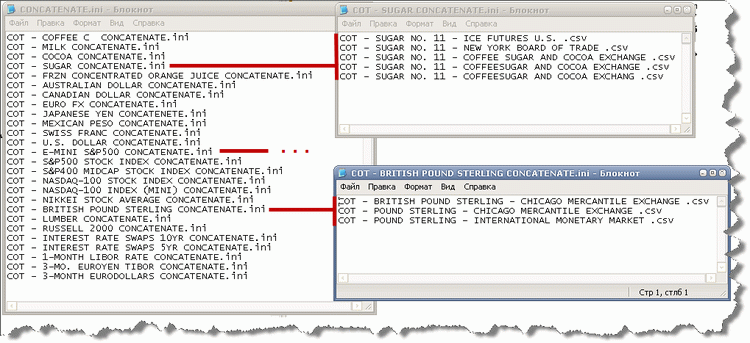
Figure 3-10. Взаимосвязь файла concatenate.ini с файлами перечислениями
3.3 Combined Reports as a New Analysis Tool
There are many related goods, which has CFTC reports. For
example, the market price of the feeder cattle and live cattle are strongly correlated. The wheat is trades on three U.S. exhanges and its prices are very close to each other.
It is naturally to assume that the actions of all participants on these markets will also be approximately the same. So why do not combine the reports on these markets in the one combined report? For example, if operators have a 20 100 contracts in the market of live cattle and 15 200 contracts in the market of feeder cattler, then their combined market cattle position as such amount to 35 300 contracts. Such addition can be made for all market participants, both for short and for long positions.
We can go further, and combine the actions of all parties to the markets with a common variety. How about to combine their reports for all of the currency futures in one report, and thus get our own version of the dollar index? Or we can combine the reports from all the stock indexes from the S&P 500 and Dow Jones 30. The resulting instrument will contain a much larger volumes, and will include the views of the participants not only on one particular market, but the industry as a whole!
This idea was amazingly beautiful to remain unrealized. Imagine, MetaCOT project has a tool of such kind. It's called a Meta COT Script Agregation. It works like a Meta COT Script Concatenate, with the difference in algrorithm for the reports combining. It needs a specified instrument list to combine, the file names of these instruments should be listed in a single file, the filename of the file should
be added into the file-list with list of all of the similar files.
Let's try to create a our own Dollar Index. The first we have to create the file "Dollar Index Agregation.ini" and fill it with names of the reports on all of the currency futures:
COT - EURO FX CONCATENATE.csv
COT - BRITISH POUND STERLING CONCATENATE.csv
COT - JAPANESE YEN CONCATENETE.csv
COT - AUSTRALIAN DOLLAR CONCATENATE.csv
COT - CANADIAN DOLLAR CONCATENATE.csv
COT - SWISS FRANC CONCATENATE.csv
Note that these files themselves were merged using the script Meta COT Script Concatenate. Once the names are listed, you can save a file called "COT - DOLLAR INDEX AGREGATION.ini" in the directory MetaTrader/expert/files. The name can be anything, but we'll use it. Then you should create a file AGREGATION.ini. It specifies the name of our association: COT - DOLLAR INDEX AGREGATION.ini.
Now you can save the file and run the script Meta COT Script Agregator. The script has an only one parameter - it is actually name of the file-list, which needs to proceed. Because in our case the file list names as "AGREGATION.ini", its parameter should be set as the same name file. The script will summarize the values of all of the instruments included in the file-list "COT - DOLLAR INDEX AGREGATION.ini", in our case, it will use a six files with reports on all currencies, and will create a new file with name "COT - DOLLAR INDEX AGREGATION.csv". This file will contain the summarized values of reports for all of the currency futures.
The list of files-reports which can be summed is limited only by your imagination. Using this powerful tool, you can create a new reports, a new kind of information! The main useful thing is that all actions are performed automatically and you do not have to summarize the values manually.
However, some reports may not contain data for a given period compared
with the other reports belonging to the general processing list. In
this case the program will indentify of such time gap, as will
inform you with the message like as follows: «--> Time Gap has Found: 21.04.2004.». There is nothing wrong, indeed it is typical and
happens regularly. In this scenario, the program will summarize the data from all other
instruments and creates a report including the date of 21.04.2004. In addition to data for the absent date it will contain data for the closest earlier period. This will be the first date to proceed. For example, the combined report for 21/04/2004 will contain a data for 14/04/2004 in the case of the data absence for 21st April.
Take care when you combine reports. The one group of instruments can have the same contract prices, the other groups can different. The simple example: the S&P500 index and two futures contracts on it: E-mini S&P500 and full-size S&P500. One electronic future contract is equal to the index value value of *5$, the full-size is equal to the index value of *25$. In spite of the fact that the large market-twin concedes to the small electronic twin regarding the quantity of contracts, their capitalisation can be equal and even the full-size S&P500 can be more capitalised.The question on the competent addition of values from the various markets remains is opened, however the base addition tool is already today and it can be applied with caution.
3.4 Indicators
All of the indicators are arranged on one principle, and contain the same kernel. The indicator kernel loads all of the data and calculated the values for all of the MetaCOT project indicators. An every indicator shows only the values that have defined by its task, but actually inside its code it contains the values for all of possible indicators. This approach has proved extremely successful, especially when designing the trade robot. Because of the library cotlib.mq4 calculates all the possible values of the indicators, it can be specified as the parameters to optimize!
It mean that after every new run robot will use a new indicator and its calculating period. So this way the best indicator and the best period can be determined. It can be useful to find the most suitable indicator and group of traders.
Now, when all of the necessary report files have prepared, it is necessary to load them to indicators. All of the indicators are similar and have a similar structure of their parameters.
As example, lets consider the Meta COT Net indicator:
|
Variable type |
Variable name |
Default value |
Description |
|---|---|---|---|
| int | period | 156 | Period for the indicator calculation. It used for the indicators which needs a period for calculation (COT Index, WILLCO etc). Usually 156-week averaging is used. |
| ool | ShowNoncomm | false | If it's true, the indicator will show the total net position of non-commercial traders. |
| bool | ShowOperators | true | If it's true, the indicator will show the total net position of operators. |
| bool | ShowNonrep | false | If it's true, the indicator will show the total net position of non-reportable traders. |
| bool | ShowOI | true | If it's true, the indicator will show the Open Interest Index |
| bool | load_cot_file | false | If it's true, the indicator will load the prepared report file with name, which specified by cot_file variable. |
| string | cot_file | cot-sample.txt | The variable contains the report file name which is necessary to load if the load_cot_file variable is true. |
| string | settings | settings.txt | A settings file for the correspondence between the indicator and report. The program finds the current chart name in file and uses the report with the same name. |
Figure 3-11. Variables of Meta COT Net Position indicator
The first, all of the indicators which uses an averaging, has an external variable period. By default, it is set to 156 (3 years averaging).
Secondly, all of the indicators has boolean variables, which allows to customize the indicator's draw (for example, you can define a groups of the market participants).
Third, the indicators has three variables: load_cot_file, cot_file,
settings. Lets consider them in details. For all of the indicators there is so-called "correspondence file", by default it is called "settings.ini". It is extremely inconvenient to manually select every time the name of
the report, which must be downloaded for analysis of the selected chart. So each instrument needs its own report. The file settings.ini
determines what kind of report you want to download for the current chart. For example, if the variable load_cot_file is false, and you start indicator Meta COT Net Position on the chart
GBPUSD, the indicator will automatically select the report called "COT -
BRITISH POUND STERLING CONCATENATE.csv" and upload it to the chart. All
it's possible thanks to the simple file that matches the name of the
instrument, with the report name.
By default, Meta
COT already has a such file. This is a typical CSV-file like the following:
file name of the report; indicator name; the first significant characters for 1st instrument; the first significant characters for Nth instrument
For example, if you want to download automatically reports
COT - SWISS FRANC CONCATENATE.csv, every time after the indicator attaching to the charts 6S and USDCHF, you need to add the following line to the file
COT - SWISS FRANC CONCATENATE.csv;SWISS FRANC;6S;USDCHF
In this case, the symbol «6S» is the collective name for various futures of Swiss Franc with different execution dates. For example, the Swiss Franc traded on contracts 6S_CONT; 6SU9; 6SU9#I; 6SZ9; 6SZ9#I; The first of them - continuous futures for the strategies backtesting. For the system, it is enough to specify only the first significant characters of the instrument (in this case, 6S), to use the same report for all of the Swiss Franc futures for indicators. The last line is a kind of "cap". If all file contents has been explored and the necessary reports hasn't been found, the indicator displays the name of the last report. In this case, instead of the report name used there will be a warning message: "REPORT FOR THE INSTRUMENT WASN'T FOUND!". In this case, will be uploaded a report which name definded by a variable cot_file, regardless of the variable load_cot_file.
Note
that the semicolon at the end of the line is absent. In this case,
the indicator will download the report COT - SWISS FRANC CONCATENATE.csv,
and the indicator name will change to: Meta COT Index (156):
SWISS FRANC. The "SWISS FRANC" name is taken from the second line of the column,
the averaging period is defined by the period variable, specified in brackets. The full contents of the file setting.ini, configured to work with a
specific broker can be seen in Figure 3-8. Note that the instruments of your broker may differ from these names. You need to find the corresponding names in the instruments of your broker and add them into a file settings.ini,
according to the rules described above.
There are somes case when the the instrument analysis needs to download a specific file with the report name which does not correspond to default values. In this case, you must set to true the variable load_cot_file and then specify the name of the required file report in a variable cot_file. Indicator will load the required file a report regardless of the name of this tool.
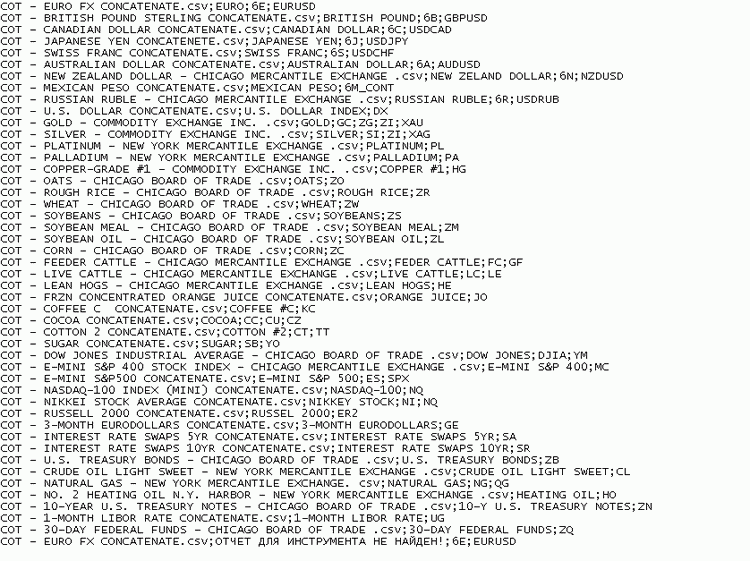
Figure 3-8. An example of the settings.ini file
For a wide range of tasks, you can use a third-party programs such as Microsoft Excel for the data analysis. In these cases it is
convenient to use the values calculated by Meta COT for the specified instrument and then download the indicator values into a third-party program. For such cases, a special script Meta COT Script
Report has been created. It needs a library cotlib.mq4 for its work. It has the same parameters as indicators: calculation period (period) and movement index (movement_index). After its run for the current instument, it will create a file Meta COT Report REPORT TITLE.csv in the \files directory. This file will contain the values of all indicators, with the
basic values for the current instrument.
Now, when all of the indicators are configured and working, it's time to delete all reports. Meta COT does not update the data, and each time it creates a set of them from scratch or appending to the existing. It means that before you run scripts, the old data must be removed. Unfortunately MetaTrader hasn't built-in function for the files delete, and we have do it manually. The most convenient way to do this - to create a batch file commands or bat-file.
This file is already exists and called
erase_cot.bat. It contains just one line:
erase COT*.csv
After run it will delete all files whose names begins from COT
with CSV extension.
After delete, file creation procedure can be repeated again.
3.5 Source code
We have developed an easily managed, modified project, which can easily be adapted to any mechanical trading system.
Mechanism of dat obtaining from the SCV Commission report is implemented in an independent program Meta COT Script Build. The algorithm is very simple program that guarantees a high degree of manageability and further modification. Initially, the program opens a list of names of files that it needs to be processed. File names contained in a file specified in its single parameter (default names.ini). When it has read the name of the first file, the script tries to open the file of the same name in the directory. If file exists, the script starts to read the SCV file, column to column, the end of the line resets the columns counter. When the column counter is referring to column needed (it checked by the special function), its value immediately recorded in the destination file, and after it writes a semicolon.
It is necessary to describe the procedure of the final file creation in detail. If the columns counter specifies that at present time the program proceed the first column (Instrument name), it reads this name and tries to open the file with the same name. If the file doesn't yet exist, the program creates it, overwise it appends the data to the end of the file. Therefore it is necessary to delete existing files each time before the data actualisation. The subsequent columns values will be loaded and added to this file. After the columns counter is nulled, the program closes the current output file. After the commission report file is processed, the program tries to open the next file specified in a file list.
It turns out that the program knows nothing about the name of the futures or the order of their grouping. In principle, the
names of all of the instruments could be placed in random order, and can be in different files. The final result will always be the
same: one instrument - one report file.
The source code for Meta COT Script Build is the following:
#property copyright "Copyright © 2009, C-4, All Rights Reserved."
#property link      "vs-box@mail.ru"
#property show_inputs
// Definitions
#define Market_and_Exchange_Names 1
#define As_of_Date_in_Form_YYMMDD 2
#define As_of_Date_in_Form_YYYY_MM_DD 3
#define CFTC_Contract_Market_Code 4
#define CFTC_Market_Code_in_Initials 5
#define CFTC_Region_Code 6
#define CFTC_Commodity_Code 7
#define Open_Interest_All 8
#define Nonc_Positions_Long_All 9
#define Nonc_Positions_Short_All 10
#define Nonc_Positions_Spreading_All 11
#define Commercial_Positions_Long_All 12
#define Commercial_Positions_Short_All 13
#define Total_Reportable_Pos_Long 14
#define Total_Reportable_Pos_Short 15
#define Nonrep_Positions_Long_All 16
#define Nonrep_Positions_Short_All 17

extern string name_list="names.ini";
//string normalize_name;
int a;
//+------------------------------------------------------------------+
//|                                                                  |
//+------------------------------------------------------------------+
int start()
  {
   int CFileNames,
   cot_file,
   tools_data;

   int column,
   column_now,
   column_string;
   int cot;
   bool IsOldInfo=true;
   string name_cotfile;
   string data,data2,
   normalize_name,
   string_cot;

   CFileNames=FileOpen(name_list,FILE_READ|FILE_CSV);
   if(TrueFileName(CFileNames,name_list)==false)return(1);
   Print("The file list: ",CFileNames);
// Open a file list with reports
   while(FileIsEnding(CFileNames)==false)
     {
      cot++;
      name_cotfile=FileReadString(CFileNames);
      cot_file=FileOpen(name_cotfile,FILE_READ|FILE_CSV,",");
      if(TrueFileName(cot_file,name_cotfile)==false)return(1);
      else Print("File not found");

      // Skip first string
      while(FileIsLineEnding(cot_file)==false)
        {
         column++;
         FileReadString(cot_file);
        }

      while(FileIsEnding(cot_file)==false)
        {
         data=FileReadString(cot_file);
         column_string++;
         if(FileIsLineEnding(cot_file)==true || FileIsEnding(cot_file)==true)
           {
            column_string=0;
            FileWrite(tools_data,string_cot);
            FileClose(tools_data);
            string_cot="";
           }
         else
           {
            if(TrueDataNew(column_string)==true)
              {// check for the comma in the instrument name
               data=NormalizeData(data);
               if(column_string==Market_and_Exchange_Names)
                 {

                  data2=FileReadString(cot_file);        // see comment1!
                  if(CheckValidColumn(data2)==true)      //
                     data=data+NormalizeColumn(data2);   //
                  else column_string++;
                  //data=NormalizeNames(data);
                  tools_data=FileOpen("COT - "+data+".csv",FILE_READ|FILE_WRITE|FILE_CSV);
                  TrueFileName(tools_data,data);
                  FileSeek(tools_data,0,SEEK_END);
                  string_cot=string_cot+data;
                 }
               else
                 {
                  if(column_string==As_of_Date_in_Form_YYYY_MM_DD)data=ConvertData(data);
                  string_cot=string_cot+";"+data;
                 }
              }
           }
        }
      Print("Total lines: ",column);
     }
   Print(a);
   return(0);
  }

//+------------------------------------------------------------------+
//|                                                                  |
//+------------------------------------------------------------------+
string ConvertData(string data)
  {
   string c_data="";
   int strlen=StringLen(data);
   int char;
   for(int i=0;i<strlen;i++)
     {
      char=StringGetChar(data,i);
      if(char=='-')c_data=c_data+".";
      else c_data=StringConcatenate(c_data,CharToStr(char));
     }
   return(c_data);
  }
// If the current cell is necessary for combined COT report, it returns true,
// Overwise it returns false. The list of the cells used are set as defines
bool TrueDataNew(int column_string)
  {
   switch(column_string)
     {
      case Market_and_Exchange_Names:
      case As_of_Date_in_Form_YYYY_MM_DD:
      case Open_Interest_All:
      case Nonc_Positions_Long_All:
      case Nonc_Positions_Short_All:
      case Nonc_Positions_Spreading_All:
      case Commercial_Positions_Long_All:
      case Commercial_Positions_Short_All:
      case Total_Reportable_Pos_Long:
      case Total_Reportable_Pos_Short:
      case Nonrep_Positions_Long_All:
      case Nonrep_Positions_Short_All:
         return(true);
      default:
         return(false);
     }
  }

//+------------------------------------------------------------------+
//|                                                                  |
//+------------------------------------------------------------------+
string NormalizeData(string file_name)
  {

   int char;
   int strlen;
   string normalize_name="";
   string normalize_name_p="";
   strlen=StringLen(file_name);
   for(int i=0;i<strlen;i++)
     {
      char=StringGetChar(file_name,i);
      switch(char)
        {
         case '/':
         case '\\':
         case ':':
         case '*':
         case '\"':
         case '<':
         case '>':
         case '|':
         case ';':
            break;
         default:
            // If the last symbol of the string is space, delete it.
            //if(char==" "&&i==strlen-1)break;
            normalize_name=StringConcatenate(normalize_name,CharToStr(char));
        }
     }
   return(normalize_name);
  }
//+------------------------------------------------------------------+
//|                                                                  |
//+------------------------------------------------------------------+
string NormalizeNames(string data)
  {
   int strlen=StringLen(data);
   string n_data;
   data=StringTrimRight(data);
   if(CharToStr(StringGetChar(data,strlen-1))==".")StringSetChar(data,strlen-1,"");
   return(data);
  }
//+------------------------------------------------------------------+
//|                                                                  |
//+------------------------------------------------------------------+
bool TrueFileName(int handle,string filename)
  {
   if(handle==-1)
     {
      Print("Can't open the file: ",filename," Last Error: ",GetLastError());
      return(false);
     }
   else return(true);
  }
//+------------------------------------------------------------------+
//|                                                                  |
//+------------------------------------------------------------------+
bool CheckValidColumn(string column_name)
  {
   int strlen=StringLen(column_name);
   if(StringFind(column_name,"\"")!=-1){a++;return(true);}
   return(false);
  }
//+------------------------------------------------------------------+
//|                                                                  |
//+------------------------------------------------------------------+
string NormalizeColumn(string column)
  {
   string n_column;
   int char;
   int strlen=StringLen(column);
   for(int i=0;i<strlen;i++)
     {
      char=StringGetChar(column,i);
      if(char=='\"')continue;
      else n_column=StringConcatenate(n_column,CharToStr(char));
     }
   return(n_column);
  }
//+------------------------------------------------------------------+
The indicator work is more difficult. All of the indicators are mostly consist of the same code - the cotlib.mq4 library. Its structure can be divided into several parts:
1. Definition - description of preprocessor constants, data tables (set of arrays);
2. Initialization - calculating the size of downloaded data and
the redistribution of the size of arrays (function init_data ());
3. Loading data from report file (function load_data ());
4. Calculation of the indicator values using the report data (function count_data ());
To access to the indicator values the function get_data (int type, int bar) is used. It has two parameters: the number of indicator values which must be returned and the bar index that you want to get the value of the indicator. For example, if you want to get the indicator values of WILLCO indicator of the operators for the current bar (bar = 0), then the function call should be: get_data (WILLCO_OPERATORS, 0); "WILLCO_OPERATORS" here is the definition of a named integer constant, specified to the preprocessor.
The averaging period for all the calculated indicators are the same and should be chosen before the indicator's initialization (after the input parameters changing, the indicator initialization occurs automatically). The file that is necessary to read is determined automatically by function void settings_load (void). It opens the configuration file (default settings.ini) and tries to find the current instrument (Symbol ()) in the instruments list of the required reports. If a report matches the name of this instrument, the function download it, if there is no report for the current instument - it loads the instrument by default (parameter name).
#property copyright "Copyright © 2009, C-4, All Rights Reserved."
#property link      "vs-box@mail.ru"
// Possible "type" of parameter values for function get_data()
#define OI                    0
#define NONCOMM_LONG          1
#define NONCOMM_SHORT         2
#define OPERATORS_LONG        3
#define OPERATORS_SHORT       4
#define NONREP_LONG           5
#define NONREP_SHORT          6
#define NET_NONCOMM           7
#define NET_OPERATORS         8
#define NET_NONREP            9
#define OI_NONCOMM_LONG       10
#define OI_NONCOMM_SHORT      11
#define OI_OPERATORS_LONG     12
#define OI_OPERATORS_SHORT    13
#define OI_NONREP_LONG        14
#define OI_NONREP_SHORT       15
#define WILLCO_NONCOMM        16
#define WILLCO_OPERATORS      17
#define WILLCO_NONREP         18
#define INDEX_OI              19
#define INDEX_NONCOMM         20
#define INDEX_OPERATORS       21
#define INDEX_NONREP          22
#define MOVEMENT_NONCOMM      23
#define MOVEMENT_OPERATORS    24
#define MOVEMENT_NONREP       25
#define MOVEMENT_OI           26
#define OI_NET_NONCOMM        27
#define OI_NET_OPERATORS      28
#define OI_NET_NONREP         29


extern bool   load_cot_file=false;
extern string cot_file="COT - U.S. DOLLAR CONCATENATE.csv";
extern string settings="settings.ini";
string name;
bool error=false;
int column;
bool DrawData=true;
bool LoadData=true;


//**********************************************************************************************************
//                                     COT DATA TABLE
int n_str;                    // number of strings

                              // Array with dates
datetime realize_data[];
// Arrays with absolute positions
double open_interest[];       // Open Interest value
double noncomm_long[];        // Long positions of non-commercial traders
double noncomm_short[];       // Short positions of non-commercial traders
double noncomm_spread[];      // Spread of non-commercial traders
double operators_long[];      // Long positions of operators
double operators_short[];     // Short positions of operators
double nonrep_long[];         // Long positions of unreported traders (crowd)
double nonrep_short[];        // Shortpositions of unreported traders (crowd)

                              // An arrays contain the result of division of the absolute long position
                              // by short position for each of the category of traders

double oi_noncomm_long[];     // Open Interest / Long positions of noncommercial traders
double oi_noncomm_short[];    // Open Interest / Short positions of noncommercial traders
double oi_operators_long[];   // Open Interest / Long positions of noncommercial traders (operators)
double oi_operators_short[];  // Open Interest / Short positions of noncommercial traders (operators)
double oi_nonrep_long[];      // Open Interest / Long positions of unreported traders (crowd)
double oi_nonrep_short[];     // Open Interest / Short positions of unreported traders (crowd)

                              // An arrays contain the result of division of the total net position by Open Interest
                              // for each of the category of traders, it used for WILLCO calculation
double oi_net_noncomm[];
double oi_net_operators[];
double oi_net_nonrep[];

// Arrays with net positions of several groups of traders
double net_noncomm[];         // Net position of noncommercial traders
double net_operators[];       // Net position of commercial traders
double net_nonrep[];          // Net position of unreported traders

double index_oi[];            // Index of Open Interest
double index_ncomm[];         // Index of noncommercial traders
double index_operators[];     // Index of commercial traders (operators)
double index_nonrep[];        // Index of unreported traders (crowd)

                              // Arrays with Stochastic, calculated on division of
                              // Open Interest by Total net position for each category of traders
                              // Stohastic(OI/NET_POSITION)
double willco_ncomm[];        //
double willco_operators[];    //
double willco_nonrep[];       //

                              //MOVEMENT INDEX
double movement_oi[];
double movement_ncomm[];
double movement_operators[];
double movement_nonrep[];
//**********************************************************************************************************
//
bool init_data()
  {
   string data;
   int handle_cotfile;
   int str;
   settings_load();
   handle_cotfile=FileOpen(cot_file,FILE_READ|FILE_CSV);
//handle_cotfile=FileOpen("COT - U.S. DOLLAR CONCATENATE.csv",FILE_READ|FILE_CSV);
   if(handle_cotfile==-1)
     {
      Print("Can't load file. The further work is not possible ",cot_file);
      Print(GetLastError());
      return(false);
     }
   while(FileIsEnding(handle_cotfile)==false)
     {
      data=FileReadString(handle_cotfile);
      if(FileIsLineEnding(handle_cotfile) && data!="")str++;
     }
   ArrayResize(realize_data,str);

   ArrayResize(open_interest,str);
   ArrayResize(noncomm_long,str);
   ArrayResize(noncomm_short,str);
   ArrayResize(noncomm_spread,str);
   ArrayResize(operators_long,str);
   ArrayResize(operators_short,str);
   ArrayResize(nonrep_long,str);
   ArrayResize(nonrep_short,str);

   ArrayResize(oi_noncomm_long,str);
   ArrayResize(oi_noncomm_short,str);
   ArrayResize(oi_operators_long,str);
   ArrayResize(oi_operators_short,str);
   ArrayResize(oi_nonrep_long,str);
   ArrayResize(oi_nonrep_short,str);

   ArrayResize(oi_net_noncomm,str);
   ArrayResize(oi_net_operators,str);
   ArrayResize(oi_net_nonrep,str);

   ArrayResize(net_noncomm,str);
   ArrayResize(net_operators,str);
   ArrayResize(net_nonrep,str);

   ArrayResize(index_oi,str);
   ArrayResize(index_ncomm,str);
   ArrayResize(index_operators,str);
   ArrayResize(index_nonrep,str);

   ArrayResize(willco_ncomm,str);
   ArrayResize(willco_operators,str);
   ArrayResize(willco_nonrep,str);

   ArrayResize(movement_oi,str);
   ArrayResize(movement_ncomm,str);
   ArrayResize(movement_operators,str);
   ArrayResize(movement_nonrep,str);

   FileClose(handle_cotfile);
   return(true);
  }

void settings_load()
  {
   int h_set,_column;
   string set,sname;
   if(load_cot_file==true)return;
   h_set=FileOpen(settings,FILE_READ|FILE_CSV,";");
//FileOpen("\Temp\Cot_file.txt",FILE_WRITE,FILE_CSV);
   if(h_set==-1)return;
   while(FileIsEnding(h_set)==false)
     {
      set=FileReadString(h_set);
      _column++;
      if(set==Symbol() && _column!=1){cot_file=sname;return;}
      if(_column==2 && set!="")name=set;    // The second column is the desired indicator name
      if(FileIsLineEnding(h_set)==true)_column=0;
      if(_column==1)sname=set;

     }
   FileClose(h_set);
  }
//+------------------------------------------------------------------+
//|                                                                  |
//+------------------------------------------------------------------+
void load_data()
  {
   datetime data_realize;
   int handle_cotfile;
   string data;
   handle_cotfile=FileOpen(cot_file,FILE_READ|FILE_CSV,";");
   Print("Файл найден");
   while(FileIsEnding(handle_cotfile)==false)
     {
      data=FileReadString(handle_cotfile);
      column++;
      if(FileIsLineEnding(handle_cotfile)==true || FileIsEnding(handle_cotfile)==true)
        {//column=12 - special case
         if(column==12)
            nonrep_short[n_str]=StrToDouble(data);
         column=0;
         if(data!="")n_str++;
        }
      else
        {
         switch(column)
           {
            case 2:
               realize_data[n_str]=StrToTime(data);
               break;
            case 3:
               open_interest[n_str]=StrToDouble(data);
               //Print(open_interest[n_str]);
               break;
            case 4:
               noncomm_long[n_str]=StrToDouble(data);
               break;
            case 5:
               noncomm_short[n_str]=StrToDouble(data);
               break;
            case 6:
               noncomm_spread[n_str]=StrToDouble(data);
               break;
            case 7:
               operators_long[n_str]=StrToDouble(data);
               break;
            case 8:
               operators_short[n_str]=StrToDouble(data);
               break;
            case 11:
               nonrep_long[n_str]=StrToDouble(data);
               break;
           }
        }
     }
   FileClose(handle_cotfile);
   Print("Fil loaded");
  }
//+------------------------------------------------------------------+
//|                                                                  |
//+------------------------------------------------------------------+
void count_data()
  {
   int    max,
   min;
   double delta;

   for(int i=0;i<n_str;i++)
     {
      index_oi[i]=EMPTY_VALUE;
      index_ncomm[i]=EMPTY_VALUE;
      index_operators[i]=EMPTY_VALUE;
      index_nonrep[i]=EMPTY_VALUE;
      willco_ncomm[i]=EMPTY_VALUE;
      willco_operators[i]=EMPTY_VALUE;
      willco_nonrep[i]=EMPTY_VALUE;
      movement_ncomm[i]=EMPTY_VALUE;
      movement_operators[i]=EMPTY_VALUE;
      movement_nonrep[i]=EMPTY_VALUE;
     }
   for(i=0;i<n_str;i++)
     {
      if(open_interest[i]==0)
        {
         oi_noncomm_long[i]=0;
         oi_noncomm_short[i]=0;
         oi_operators_long[i]=0;
         oi_operators_short[i]=0;
         oi_nonrep_long[i]=0;
         oi_nonrep_short[i]=0;
        }
      else
        {
         oi_noncomm_long[i]=noncomm_long[i]/open_interest[i];
         oi_noncomm_short[i]=noncomm_short[i]/open_interest[i];
         oi_operators_long[i]=operators_long[i]/open_interest[i];
         oi_operators_short[i]=operators_short[i]/open_interest[i];
         oi_nonrep_long[i]=nonrep_long[i]/open_interest[i];
         oi_nonrep_short[i]=nonrep_short[i]/open_interest[i];
        }

      net_noncomm[i]=noncomm_long[i]-noncomm_short[i];
      net_operators[i]=operators_long[i]-operators_short[i];
      net_nonrep[i]=nonrep_long[i]-nonrep_short[i];

      if(open_interest[i]==0)
        {
         oi_net_noncomm[i]=0;
         oi_net_operators[i]=0;
         oi_net_nonrep[i]=0;
        }
      else
        {
         oi_net_noncomm[i]=net_noncomm[i]/open_interest[i];
         oi_net_operators[i]=net_operators[i]/open_interest[i];
         oi_net_nonrep[i]=net_nonrep[i]/open_interest[i];
        }
     }

   for(i=0;i<n_str-period;i++)
     {

      max=ArrayMaximum(open_interest,period,i);
      min=ArrayMinimum(open_interest,period,i);
      delta=open_interest[max]-open_interest[min];
      if(delta==0)delta=1;
      index_oi[i]=(open_interest[i]-open_interest[min])/delta*100;

      max=ArrayMaximum(net_noncomm,period,i);
      min=ArrayMinimum(net_noncomm,period,i);
      delta=net_noncomm[max]-net_noncomm[min];
      if(delta==0)delta=1;
      index_ncomm[i]=(net_noncomm[i]-net_noncomm[min])/delta*100;

      max=ArrayMaximum(net_operators,period,i);
      min=ArrayMinimum(net_operators,period,i);
      delta=net_operators[max]-net_operators[min];
      if(delta==0)delta=1;
      index_operators[i]=(net_operators[i]-net_operators[min])/delta*100;

      max=ArrayMaximum(net_nonrep,period,i);
      min=ArrayMinimum(net_nonrep,period,i);
      delta=net_nonrep[max]-net_nonrep[min];
      if(delta==0)delta=1;
      index_nonrep[i]=(net_nonrep[i]-net_nonrep[min])/delta*100;

      max=ArrayMaximum(oi_net_noncomm,period,i);
      min=ArrayMinimum(oi_net_noncomm,period,i);
      delta=oi_net_noncomm[max]-oi_net_noncomm[min];
      if(delta==0)delta=1;
      willco_ncomm[i]=(oi_net_noncomm[i]-oi_net_noncomm[min])/delta*100;

      max=ArrayMaximum(oi_net_operators,period,i);
      min=ArrayMinimum(oi_net_operators,period,i);
      delta=oi_net_operators[max]-oi_net_operators[min];
      if(delta==0)delta=1;
      willco_operators[i]=(oi_net_operators[i]-oi_net_operators[min])/delta*100;

      max=ArrayMaximum(oi_net_nonrep,period,i);
      min=ArrayMinimum(oi_net_nonrep,period,i);
      delta=oi_net_nonrep[max]-oi_net_nonrep[min];
      if(delta==0)delta=1;
      willco_nonrep[i]=(oi_net_nonrep[i]-oi_net_nonrep[min])/delta*100;
     }
   for(i=0;i<n_str-period-movement_index;i++)
     {
      movement_oi[i]=index_oi[i]-index_oi[i-movement_index];
      movement_ncomm[i]=index_ncomm[i]-index_ncomm[i-movement_index];
      movement_operators[i]=index_operators[i]-index_operators[i-movement_index];
      movement_nonrep[i]=index_nonrep[i]-index_nonrep[i-movement_index];
     }
  }
// Returns one of the COT table values
// defined by "type" variable and bar defined by "bar"
double get_data(int type,int bar)
  {
   double data;
   int i_data=get_cot(bar);
   if(i_data==EMPTY_VALUE)return(EMPTY_VALUE);
   switch(type)
     {
      case OI:
         return(open_interest[i_data]);
      case NONCOMM_LONG:
         return(noncomm_long[i_data]+noncomm_spread[i_data]);
         //return(noncomm_long[i_data]);
      case NONCOMM_SHORT:
         return(noncomm_short[i_data]+noncomm_spread[i_data]);
         //return(noncomm_short[i_data]);
      case OPERATORS_LONG:
         return(operators_long[i_data]);
      case OPERATORS_SHORT:
         return(operators_short[i_data]);
      case NONREP_LONG:
         return(nonrep_long[i_data]);
      case NONREP_SHORT:
         return(nonrep_short[i_data]);
      case NET_NONCOMM:
         return(net_noncomm[i_data]);
      case NET_OPERATORS:
         return(net_operators[i_data]);
      case NET_NONREP:
         return(net_nonrep[i_data]);
      case INDEX_OI:
         return(index_oi[i_data]);
      case INDEX_NONCOMM:
         return(index_ncomm[i_data]);
      case INDEX_OPERATORS:
         return(index_operators[i_data]);
      case INDEX_NONREP:
         return(index_nonrep[i_data]);
      case OI_NONCOMM_LONG:
         return(oi_noncomm_long[i_data]);
      case OI_NONCOMM_SHORT:
         return(oi_noncomm_short[i_data]);
      case OI_OPERATORS_LONG:
         return(oi_operators_long[i_data]);
      case OI_OPERATORS_SHORT:
         return(oi_operators_short[i_data]);
      case OI_NONREP_LONG:
         return(oi_nonrep_long[i_data]);
      case OI_NONREP_SHORT:
         return(oi_nonrep_short[i_data]);
      case WILLCO_NONCOMM:
         return(willco_ncomm[i_data]);
      case WILLCO_OPERATORS:
         return(willco_operators[i_data]);
      case WILLCO_NONREP:
         return(willco_nonrep[i_data]);
      case OI_NET_NONCOMM:
         return(oi_net_nonrep[i_data]);
      case OI_NET_OPERATORS:
         return(oi_net_operators[i_data]);
      case OI_NET_NONREP:
         return(oi_net_nonrep[i_data]);
      case MOVEMENT_NONCOMM:
         return(movement_ncomm[i_data]);
      case MOVEMENT_OPERATORS:
         return(movement_operators[i_data]);
      case MOVEMENT_NONREP:
         return(movement_nonrep[i_data]);
      case MOVEMENT_OI:
         return(movement_oi[i_data]);
     }
   return(EMPTY_VALUE);
  }
// Returns the cell number in array
// It returns an EMPTY_VALUE, if bar hasn't been found
int get_cot(int i)
  {
   datetime tbar=iTime(Symbol(),0,i);
   for(int k=0;k<n_str;k++)
      if(realize_data[k]<tbar)return(k);
   return(EMPTY_VALUE);
  }
// Returns bar with the last COT data exist
int get_lastdata()
  {
   return(iBarShift(Symbol(),0,realize_data[n_str-1],false));
  }
// Returns a string without extension and first 6 symbols
// (before was "COT - FileName.csv", it became "FileName")
string str_trim(string fname)
  {
   int strlen=StringLen(fname)-1;
   int char;
   string str;
   for(int i=strlen;i>0;i--)
     {
      char=StringGetChar(fname,i);
      if(char=='.')
        {
         for(int b=6;b<i;b++) // change to b=0, if it is not necessary
                              // to delete the first of 6 symbols
            str=str+CharToStr(StringGetChar(fname,b));
         return(str);
        }
     }
   return(fname);
  }
//+------------------------------------------------------------------+
The code of the indicators themselves is trivial and differs only by the number of initialized buffers and the first parameter of the function get_data (). All of the values are calculated in advance, at the stage of initialization, so they don't use the function IndicatorCounted (). In the beginning, during initialization, the basic functions from the library cotlib.mq4 are called, it configures a charts, and then starts the function start (). It runs at once the function once build_data (), which displays the data in the indicator window for the time period of the report data.
As example, here is the source code of the indicator WILLCO:
#property copyright "Copyright © 2009, C-4, All Rights Reserved."
#property link      "vs-box@mail.ru"

#property indicator_separate_window
#property  indicator_buffers 3
#property  indicator_color1  Green
#property  indicator_color2  Red
#property  indicator_color3  Blue

extern int  period=52;
int movement_index=6;
extern bool Show_iNoncomm=false;
extern bool Show_iOperators=true;
extern bool Show_iNonrep=false;

double i_willco_noncomm[];
double i_willco_operators[];
double i_willco_nonrep[];

#include <cotlib.mq4>
//+------------------------------------------------------------------+
//|                                                                  |
//+------------------------------------------------------------------+
int init()
  {
   if(init_data()==false)error=true;
   if(error==false)load_data();
   if(error==false)count_data();
//if(error==false)count_index(period);
   SetParam();
  }
//+------------------------------------------------------------------+
//|                                                                  |
//+------------------------------------------------------------------+
int start()
  {
   if(error==true)Print("Can't load data. The further work is impossible");
   if(DrawData==true)build_data();
  }
//+------------------------------------------------------------------+
//|                                                                  |
//+------------------------------------------------------------------+
void SetParam()
  {
   SetIndexStyle(0,DRAW_LINE);
   SetIndexStyle(1,DRAW_LINE);
   SetIndexStyle(2,DRAW_LINE);
   IndicatorDigits(2);
   SetIndexEmptyValue(0,EMPTY_VALUE);
   SetIndexEmptyValue(1,EMPTY_VALUE);
   SetIndexEmptyValue(2,EMPTY_VALUE);
   SetLevelValue(0,0.0);
   SetLevelValue(1,20.0);
   SetLevelValue(2,80.0);
   SetLevelValue(3,100.0);
   if(load_cot_file==true)IndicatorShortName(StringConcatenate("Meta COT WILLCO (",period,"): ",str_trim(cot_file)));
   else IndicatorShortName(StringConcatenate("Meta COT WILLCO (",period,"): ",name));
   if(Show_iNoncomm==true)
     {
      SetIndexBuffer(0,i_willco_noncomm);
      SetIndexLabel(0,"WILLCO: Noncommercial Traders");
     }
   if(Show_iOperators==true)
     {
      SetIndexBuffer(1,i_willco_operators);
      SetIndexLabel(1,"WILLCO: Operators Traders");
     }
   if(Show_iNonrep==true)
     {
      SetIndexBuffer(2,i_willco_nonrep);
      SetIndexLabel(2,"WILLCO: Nonrep Traders");
     }
  }

void build_data()
  {
   int end_data=get_lastdata();
   for(int i=0;i<end_data;i++)
     {
      if(Show_iNoncomm)
        {
         i_willco_noncomm[i]=get_data(WILLCO_NONCOMM,i);
         if(Show_iOperators)i_willco_operators[i]=get_data(WILLCO_OPERATORS,i);
         if(Show_iNonrep)i_willco_nonrep[i]=get_data(WILLCO_NONREP,i);
        }
      DrawData=false;
     }
//+------------------------------------------------------------------+


// The most difficult part of the program was to create a script for the summation of data in one report.
// There are many algorithmic problems has been solved. The program was written in the old C-style.
// It consists a single unit without function calls. Such approach may seem inefficient or even incorrect,
// but in this case it was the best solution to solve the problem immediately without dividing it into the different "subtasks".

// In the beginning, the program opens the file-list, reads the file names to combine and opens them one by one.
// Each of the file has a list of reports that need to be combined. The program opens these reports all at once,
// reads the values from them and process them line by line (in the format SCV line is one column).
// Then it adds these values together, if their have the identical dates (the values of the econd column).
// The sum the values is recorded into the final file, which has the same name as file to combine, but CSV extension.


#property copyright "Copyright © 2009, C-4, All Rights Reserved."
#property link      "vs-box@mail.ru"

#define EQU_NO           0
#define EQU_YES          1

#define DATA            1
#define OI              2
#define NONCOMM_LONG    3
#define NONCOMM_SHORT   4
#define SPREADING       5
#define OPERATORS_LONG  6
#define OPERATORS_SHORT 7
#define ALL_LONG        8
#define ALL_SHORT       9
#define NONREP_LONG     10
#define NONREP_SHORT    11

extern string s_list="AGREGATION.ini";
//+------------------------------------------------------------------+
//|                                                                  |
//+------------------------------------------------------------------+
int start()
  {
   int      h_list;                    // File list descriptor
                                       // (it contain a file list)
                                       // string   s_list;                    // File name

   int      h_enumeration;             // Descriptor of the enumeration file
   string   s_enumeration;             // Filename of the enumeraton file

   int      h_rezult;                  // Description of the output file
   string   s_rezult;                  // Filename of the output file

   int      h_temp;                    // Temporary descriptor (one for all)
                                       // used for the file counting
   string   s_temp;                    // Temporary string (one for all),
                                       // used for the file counting

   int      h_file[];                  // Array of descriptors for the output files
   string   s_file[];                  // Array with the names for the output files

   datetime data[],data_all;
   int      oi[],oi_all,
   noncomm_long[],noncomm_long_all,
   noncomm_short[],noncomm_short_all,
   spreading[],spreading_all,
   operators_long[],operators_long_all,
   operators_short[],operators_short_all,
   all_long[],all_long_all,
   all_short[],all_short_all,
   nonrep_long[],nonrep_long_all,
   nonrep_short[],nonrep_short_all;

   int      str;                       // Count of the result files
   int      n;                         // The current index of the result files
   int      column;                    // Column number
   int      frnz_str[];                // Frozen descriptiors
   double   count;                     // Count the string count for the result file
   string   tmp;                       // A text string for the result file

   h_list=FileOpen(s_list,FILE_READ|FILE_CSV);                    // Открываем список файлов
   if(h_list==-1){Print("File list not found");return(0);}
   while(FileIsEnding(h_list)==false)
     {                            // Reading it string by string
      s_enumeration=FileReadString(h_list);                       // Each string has a filename
      Print("---------------<<",s_enumeration,">>---------------");
      h_enumeration=FileOpen(s_enumeration,FILE_READ|FILE_CSV);   // Try to open enumeration file list
      if(h_enumeration==-1)
        {
         Print("The enumeration file not found ",s_enumeration);
         continue;                                                // If it does not exist, skip it
        }

      s_rezult=StringConcatenate(ConvertName(s_enumeration),".csv");
      h_rezult=FileOpen(s_rezult,FILE_WRITE|FILE_CSV);
      if(h_rezult==-1)
        {
         Print("Can't create a result file: ",s_rezult,"; ",GetLastError());
         continue;
        }
      while(FileIsEnding(h_enumeration)==false)
        {
         s_temp=FileReadString(h_enumeration);                  // Reading string by string enumeration file
                                                                // each string is the name of the final file
         h_temp=FileOpen(s_temp,FILE_READ|FILE_CSV);            // Try to open the result file
         if(h_temp==-1)continue;        // If result file does not exists, skip it
         str++;                                                 // Overwise we increasing by 1 the count of the files processed.
                                                                // Print("--> ",s_temp);
         while(FileIsEnding(h_temp)==false)
           {
            tmp=FileReadString(h_temp);
            if(tmp!="")count++;
           }
         Print("--> ",s_temp," ",count/12);
         count=0;
         FileClose(h_temp);                                    // Closing result file
        }//End While (counting the files with enumerations)
      FileSeek(h_enumeration,0,SEEK_SET);

      ArrayResize(h_file,str);
      ArrayResize(s_file,str);
      ArrayResize(data,str);
      ArrayResize(oi,str);
      ArrayResize(noncomm_long,str);
      ArrayResize(noncomm_short,str);
      ArrayResize(spreading,str);
      ArrayResize(operators_long,str);
      ArrayResize(operators_short,str);
      ArrayResize(all_long,str);
      ArrayResize(all_short,str);
      ArrayResize(nonrep_long,str);
      ArrayResize(nonrep_short,str);
      ArrayResize(frnz_str,str);
      while(FileIsEnding(h_enumeration)==false)
        {
         s_file[n]=FileReadString(h_enumeration);              // Reading enumeration file string by string
                                                               // each string is the name of the result file
                                                               // Print(str,"; ",s_file[n]);
         h_file[n]=FileOpen(s_file[n],FILE_READ|FILE_CSV);     // Try to open the final file
         if(h_file[n]==-1){Print("File not found");continue;}  // It it does not exist, skip it
         n++;
        }// End While( open enumerations file)
      //for(n=0;n<str;n++){
      //   Print(n,"; ",s_file[n]);
      //}
      // At present time we have the list of the result files(s_file[])
      // and their descriptors (h_file[]) which are
      // in the single enumerations file. Now lets combine these files to a single file:
      while(FileIsEnding(h_file[0])==false)
        {
                                 // As a signal of the end of the file there is a end of the first file
                                 // (we assume theat the files are the same)

         for(int i=0;i<str;i++)
           {                     // Reading column by column for each of the file included in the enumerations file.
            if(frnz_str[i]==1)continue;
            tmp=FileReadString(h_file[i]);
            switch(column)
              {
               case DATA:            data[i]=StrToTime(tmp);
               case OI:              oi[i]=StrToInteger(tmp);
               case NONCOMM_LONG:    noncomm_long[i]=StrToInteger(tmp);
               case NONCOMM_SHORT:   noncomm_short[i]=StrToInteger(tmp);
               case SPREADING:       spreading[i]=StrToInteger(tmp);
               case OPERATORS_LONG:  operators_long[i]=StrToInteger(tmp);
               case OPERATORS_SHORT: operators_short[i]=StrToInteger(tmp);
               case ALL_LONG:        all_long[i]=StrToInteger(tmp);
               case ALL_SHORT:       all_short[i]=StrToInteger(tmp);
               case NONREP_LONG:     nonrep_long[i]=StrToInteger(tmp);
               case NONREP_SHORT:    nonrep_short[i]=StrToInteger(tmp);
              }
           }// End For()
         //Print(h_file[0], ";  ",s_file[0]);
         column++;
         if(FileIsLineEnding(h_file[0])==true || FileIsEnding(h_file[0])==true)
           {   // If string has finished - compare the dates for all of the files, is they are equal, combine them
            column=0;
            if(tmp=="")continue;
            for(int k=0;k<str;k++)
              {
               if(data[0]>data[k])
                  frnz_str[k]=1;
               if(data[0]<data[k])
                  frnz_str[0]=1;
               if(data[0]==data[k])frnz_str[k]=0;
               if(data[0]!=data[k])
                 {
                  Print("Time Gap was found: ",TimeToStr(data[0],TIME_DATE),"; ",TimeToStr(data[k],TIME_DATE));
                  continue;
                 }
              }

            for(k=0;k<str;k++)
              {
               data_all=data[0];
               oi_all+=oi[k];
               noncomm_long_all+=noncomm_long[k];
               noncomm_short_all+=noncomm_short[k];
               spreading_all+=spreading[k];
               operators_long_all+=operators_long[k];
               operators_short_all+=operators_short[k];
               all_long_all+=all_long[k];
               all_short_all+=all_short[k];
               nonrep_long_all+=nonrep_long[k];
               nonrep_short_all+=nonrep_short[k];
              }
            FileWrite(h_rezult,ConvertName(s_enumeration),
                      TimeToStr(data_all,TIME_DATE),
                      oi_all,
                      noncomm_long_all,
                      noncomm_short_all,
                      spreading_all,
                      operators_long_all,
                      operators_short_all,
                      all_long_all,
                      all_short_all,
                      nonrep_long_all,
                      nonrep_short_all);
            //Print(TimeToStr(data_all,TIME_DATE),";  ",oi_all);
            data_all=0;
            oi_all=0;
            noncomm_long_all=0;
            noncomm_short_all=0;
            spreading_all=0;
            operators_long_all=0;
            operators_short_all=0;
            all_long_all=0;
            all_short_all=0;
            nonrep_long_all=0;
            nonrep_short_all=0;
           }

        }// End While(summation)

      // Zero results
      FileClose(h_enumeration);
      FileClose(h_rezult);
/*for(int j=0;j<str;j++){
         FileClose(h_file[j]);
         noncomm_long[j]=0;
         noncomm_short[j]=0;
         spreading[j]=0;
         operators_long[j]=0;
         operators_short[j]=0;
         all_long[j]=0;
         all_short[j]=0;
         nonrep_long[j]=0;
         nonrep_short[j]=0;
      }*/

      n=0;str=0;
     } //End While( file enumeration list)

  }// End Programm
//+------------------------------------------------------------------+
//|                                                                  |
//+------------------------------------------------------------------+
string ConvertName(string str)
  {
   string str_cnv;
   int strlen=StringLen(str);
   int char;
   for(int i=0;i<strlen-4;i++)
     {
      char=StringGetChar(str,i);
      str_cnv=StringConcatenate(str_cnv,CharToStr(char));
     }
   return(str_cnv);
  }
//+------------------------------------------------------------------+
The program that combines the reports by dates Meta COT Script Concatenates uses the similar way, but its algorithm is simplier.
#property copyright "Copyright © 2009, C-4, All Rights Reserved."
#property link      "vs-box@mail.ru"

extern string FilesList="CONCATENATE.ini";
//+------------------------------------------------------------------+
//|                                                                  |
//+------------------------------------------------------------------+
int start()
  {
   int    h_list,h_file,h_cont,h_rezult;   // File descriptors
   int    column;
   string s_list,s_file,s_cont,s_rezult,   // Strings with file names
   string_cont,string_cont_f;
   h_list=FileOpen(FilesList,FILE_READ|FILE_CSV);      // Open the file list
   if(h_list==-1){Print("File list ("+FilesList+") not found");return(0);}
   while(FileIsEnding(h_list)==false)
     {                  // Read it string by string
      s_list=FileReadString(h_list);                      // Each string is a filename
      Print(s_list);
      h_file=FileOpen(s_list,FILE_READ|FILE_CSV);         // Try open this file
      if(h_list==-1){Print("File "+s_list+" not found");continue;}  // If it does not exists
                                                                    // we skip it
                                                                    // s_rezult="COT - CONT - "+s_list;
      s_rezult=get_rezultname(s_list);
      h_rezult=FileOpen(s_rezult,FILE_WRITE|FILE_READ|FILE_CSV);
      while(FileIsEnding(h_file)==false)
        {
         s_file=FileReadString(h_file);
         //Print(s_file);
         h_cont=FileOpen(s_file,FILE_READ|FILE_CSV,';');
         if(h_cont==-1){Print("Data file "+s_file+" not found");continue;}
         else Print("Loading data file "+s_file+"...");

         while(FileIsEnding(h_cont)==false)
           {
            string_cont=FileReadString(h_cont);
            if(string_cont=="")continue;
            if(FileIsLineEnding(h_cont)==true)
              {
               string_cont_f=string_cont_f+";"+string_cont;
               FileWrite(h_rezult,string_cont_f);
               string_cont_f="";
               column=0;
              }
            else
              {
               //if(string_cont=="")continue;
               if(column==0)string_cont_f=string_cont_f+string_cont;
               else string_cont_f=string_cont_f+";"+string_cont;
               column++;
              }
           }
         FileClose(h_cont);
        }
      FileClose(h_file);
      FileClose(h_rezult);
     }
   return(0);
  }
//+------------------------------------------------------------------+
//|                                                                  |
//+------------------------------------------------------------------+
string get_rezultname(string fname)
  {
   int strlen=StringLen(fname)-1;
   int char;
   string str;
   for(int i=strlen;i>0;i--)
     {
      char=StringGetChar(fname,i);
      if(char=='.')
        {
         for(int b=0;b<i;b++)
            str=str+CharToStr(StringGetChar(fname,b));
         str=str+".csv";
         return(str);
        }
     }
   return("COT - CONT - "+fname);
  }
//+------------------------------------------------------------------+
4. From theory to practice!
4.1 One minute and commodity trader is ready to work
So, it is time to generalize all that. The futures market has three main groups of participants: hedgers, large commodity funds and the crowd. The first and second groups are most capitalized. The crowd controls only a small part of the market, usually less than 10%, so their actions can't affect the market price. The two remaining groups are few but more powerful, they defines the interaction by the law of supply and demand.
Non-commercial traders and operators are opposites in nature. The actions of one group will be almost a mirror image of another. The first possible application of CTFC reports is: observing the balance between the two groups on the basis of the law of supply and demand.
The hedgers are more informed participants of the market than anyone else. They are closest to the goods production, so they knows about the hidden market trends much earlier than everyone else. In this case, they will always be insiders in relation to other market participants. This hidden information causes them to adjust their hedge levels, which is reflected in the CFTC reports. The second possible application is observing the rapid changes in the positions of the operators.
The crowd is considered as the least informed of all categories of traders. Often, it means that the crowd actions are caused by ridiculous rumors, the psychology of the masses, greed and fear. The sharp changes of the crowd net position is often states that the crowd mood have changed drastically under the action of all these factors and it is better to be ready to the opposite development of the situation. A third possible application is observing the rapid changes of the crowd positions.
The CFTC reports itself can't to point to the specific entry or exit from the market. This property is common to all of the fundamental indicators. You have to use effective methods of technical analysis to determine the entry and exit points more accurate.
Here are some properties that should have a trading system for the effective use of CFTC information:
1. It must be profitable, or at least neutral, even without the use of CFTC filters.
2. The system shouldn't has parameters, optimization of which changes the behavior and the final profit of the trade system. The main function of the system should to confirm the trade signals. Optimization of the auxiliary unit should not be a priority for a strategy development.
3. The system should be fully reversible. The sale signals must be a mirror of the buy signals.
4. The technique should be a counter-trend to the current local trend. The CFTC signals for sale will appear in a lengthy bull trend or at least to the strong reversal of the main motion. The buy signals will also be opposed to the underlying trend.
5. The technique should guarantee the capture of the trend reversal. All of the turning points should be considered by the system as an entry point into the market. This is the most difficult, but at the same time is the most important conditions for the trading system. The CFTC signals appears very rarely, some of the indicators generate a signal, not more than 1-2 times a year. If the tecnhique will not give a signal to enter the market in these moments, the use of CFTC reports will be meaningless.
6. When using CFTC reports information the main profit will be obtained
from just several deals, with a long time of trade, up to several months. Accordingly, the trading strategy should allow a drift of the positions for a long time.
7. The system should not exploit the properties of a particular market. CFTC Reports are available for many markets, so the system should be equally well applied to all markets, for which reports are created.
The most promising use of the technology is seen as filters. In this case, the number of deals and the maximum drawdown rapidly decrease, while the expectation of winning and the resulting profits should increase.
Now lets consider the most important signals on which to focus. There are two such signals: the open interest level and the net position of one of three categories, assume that it will be the operators. We reduce all of the report information to these two parameters, expressed through the 3-year index.
This eliminates the subjectivity and make the analysis of markets much
easier. Thus, a favorable situation for the buying will be a cold
market with low sales of the operators. The cold market means that the Open Interest level at the moment is extremely small, and therefore
there is growth potential. We will also look for the contrast
situation for sale: the market should be well warmed up (a very high
level of OI), while the operators show an extremly high level of sales.
Let us turn to the JPY indicators to identify those moments:
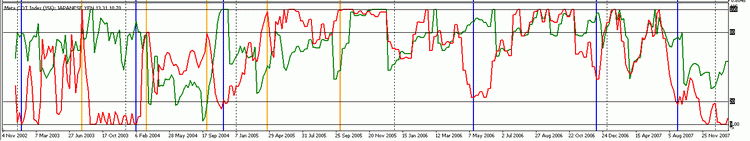
Figure 4-1. Open Interest and index of the operators for JPY futures
The blue lines shows the favorable moments to sell, the orange lines - to buy. When Open Interest is large enough (the green line above), and the operators are bears (red line below), it's favorable conditions to sell Yen. The same can be applied to buy: when Open Interest is relatively small (green line below) and the operators are bulls (red line above) it's favorable conditions to buy Yen. This data can be used for the initial market analysis, the price level is not required. Only after a favorable time for speculation has been found you can find a more suitable point to enter to the market using technical analysis. The following chart shows the same indicator but with the market price:
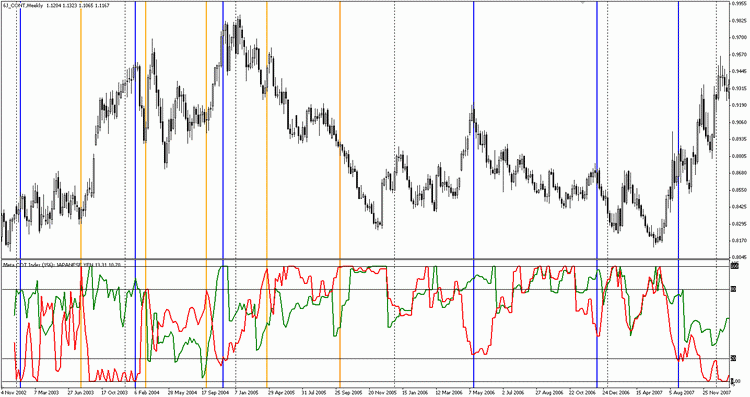
Figure 4-2. Operator's Index and Open Interest with price chart for Yen
As you can see, not all of the sell and buy signals led to greater profits. Many could even lead to serious losses. However, the hard stops should be used in any system, and this is no exception.
There is a signals of the chart with some values that didn't reached the 20% and 80% levels. These levels are not faultless. An each maket has its own optimal levels. The same is for the indicators, there is no universal level values which will be optimal to all of the markets.
Now lets examine in more detail with a view of how markets are records of transactions of traders. It should be noted that there is so much markets with regular reports. There are some markets with reports that appear within a certain period (month or year), and then disappear forever. There are some markets, trade in which had long been absent, but their information is present in the historical data. Among this it can be identified about 60 markets with reports that come out clearly and regularly. Here's markets with the most complete reports (names of data files, specified without extension CSV):
| № |
INSTRUMENT |
CSV DATA FILE |
|---|---|---|
| Commodities | ||
| 1 | LEAN HOGS | COT - LEAN HOGS - CHICAGO MERCANTILE EXCHANGE |
| 2 | FEEDER CATTLE | COT - FEEDER CATTLE - CHICAGO MERCANTILE EXCHANGE |
| 3 | LIVE CATTLE | COT - LIVE CATTLE - CHICAGO MERCANTILE EXCHANGE |
| 4 | MILK CONCATENATE | COT - MILK CONCATENATE |
| 5 | WHEAT - CHICAGO BOARD OF TRADE | COT - WHEAT - CHICAGO BOARD OF TRADE |
| 6 | WHEAT - KANSAS CITY BOARD OF TRADE | COT - WHEAT - KANSAS CITY BOARD OF TRADE |
| 7 | WHEAT - MINNEAPOLIS GRAIN EXCHANGE | COT - WHEAT - MINNEAPOLIS GRAIN EXCHANGE |
| 8 | OATS - CHICAGO BOARD OF TRADE | COT - OATS - CHICAGO BOARD OF TRADE |
| 9 | ROUGH RICE | COT - ROUGH RICE - CHICAGO BOARD OF TRADE |
| 10 | SUGAR | COT - SUGAR CONCATENATE |
| 11 | COFFEE | COT - COFFEE CONCATENATE |
| 12 | COCOA | COT - COCOA CONCATENATE |
| 13 | COTTON №2 | COT - COTTON 2 CONCATENATE |
| 14 | SOYBEAN MEAL | COT - SOYBEAN MEAL - CHICAGO BOARD OF TRADE |
| 15 | MINI SOYBEANS | COT - MINI SOYBEANS - CHICAGO BOARD OF TRADE |
| 16 | SOYBEAN OIL | COT - SOYBEAN OIL - CHICAGO BOARD OF TRADE |
| 17 | SOYBEANS | COT - SOYBEANS - CHICAGO BOARD OF TRADE |
| 18 | BUTTER (CASH SETTLED) | COT - BUTTER (CASH SETTLED) - CHICAGO MERCANTILE EXCHANGE |
| 19 | FRZN CONCENTRATED ORANGE JUICE | COT - FRZN CONCENTRATED ORANGE JUICE CONCATENATE |
| 20 | LUMBER | COT - LUMBER CONCATENATE |
| Metals | ||
| 21 | COPPER-GRADE #1 | COT - COPPER-GRADE #1 - COMMODITY EXCHANGE INC. |
| 22 | SILVER | COT - SILVER - COMMODITY EXCHANGE INC. |
| 23 | GOLD | COT - GOLD - COMMODITY EXCHANGE INC. |
| 24 | PLATINUM | COT - PLATINUM - NEW YORK MERCANTILE EXCHANGE |
| 25 | PALLADIUM | COT - PALLADIUM - NEW YORK MERCANTILE EXCHANGE |
| Currencies | ||
| 26 | AUSTRALIAN DOLLAR | COT - AUSTRALIAN DOLLAR CONCATENATE |
| 27 | CANADIAN DOLLAR | COT - CANADIAN DOLLAR CONCATENATE |
| 28 | BRITISH POUND STERLING | COT - BRITISH POUND STERLING CONCATENATE |
| 29 | EURO FX | COT - EURO FX CONCATENATE |
| 30 | APANESE YEN | COT - JAPANESE YEN CONCATENETE |
| 31 | MEXICAN PESO | COT - MEXICAN PESO CONCATENATE |
| 32 | NEW ZEALAND DOLLAR | COT - NEW ZEALAND DOLLAR - CHICAGO MERCANTILE EXCHANGE |
| 33 | SWISS FRANC CONCATENATE | COT - SWISS FRANC CONCATENATE |
| 34 | RUSSIAN RUBLE | COT - RUSSIAN RUBLE - CHICAGO MERCANTILE EXCHANGE |
| 35 | U.S. DOLLAR INDEX | COT - U.S. DOLLAR CONCATENATE |
| Indexes | ||
| 36 | DOW JONES INDUSTRIAL | COT - DOW JONES INDUSTRIAL AVERAGE - CHICAGO BOARD OF TRADE |
| 37 | DOW JONES INDUSTRIAL x5$ | COT - DOW JONES INDUSTRIAL AVG- x $5 - CHICAGO BOARD OF TRADE |
| 38 | E-MINI S&P400 | COT - E-MINI S&P 400 STOCK INDEX - CHICAGO MERCANTILE EXCHANGE |
| 39 | E-MINI S&P500 | COT - E-MINI S&P500 CONCATENATE |
| 40 | S&P500 STOCK INDEX | COT - S&P500 STOCK INDEX CONCATENATE |
| 41 | S&P400 MIDCAP STOCK INDEX | COT - S&P400 MIDCAP STOCK INDEX CONCATENATE |
| 42 | NASDAQ-100 | COT - NASDAQ-100 STOCK INDEX CONCATENATE |
| 43 | NASDAQ-100 MINI | COT - NASDAQ-100 INDEX (MINI) CONCATENATE |
| 44 | NIKKEY INDEX | COT - NIKKEI STOCK AVERAGE CONCATENATE |
| 45 | RUSSELL-2000 E-MINI | COT - RUSSELL 2000 CONCATENATE |
| Debt instruments | ||
| 46 | INTEREST RATE SWAPS 10YR | COT - INTEREST RATE SWAPS 10YR CONCATENATE |
| 47 | INTEREST RATE SWAPS 5YR | COT - INTEREST RATE SWAPS 5YR CONCATENATE |
| 48 | U.S. TREASURY BONDS | COT - U.S. TREASURY BONDS - CHICAGO BOARD OF TRADE |
| 49 | 10-YEAR U.S. TREASURY NOTES | COT - 10-YEAR U.S. TREASURY NOTES - CHICAGO BOARD OF TRADE |
| 50 | 5-YEAR U.S. TREASURY NOTES | COT - 5-YEAR U.S. TREASURY NOTES - CHICAGO BOARD OF TRADE |
| 51 | 2-YEAR U.S. TREASURY NOTES | COT - 2-YEAR U.S. TREASURY NOTES - CHICAGO BOARD OF TRADE |
| 52 | 1-MONTH LIBOR RATE | COT - 1-MONTH LIBOR RATE CONCATENATE |
| 53 | 30-DAY FEDERAL FUNDS | COT - 30-DAY FEDERAL FUNDS - CHICAGO BOARD OF TRADE |
| 54 | 3-MONTH EUROYEN | COT - 3-MONTH EUROYEN TIBOR CONCATENATE |
| 55 | 3-MONTH EURODOLLARS | COT - 3-MONTH EURODOLLARS CONCATENATE |
| Energy | ||
| 56 | CRUDE OIL LIGHT SWEET | COT - CRUDE OIL LIGHT SWEET - NEW YORK MERCANTILE EXCHANGE |
| 57 | NATURAL GAS | COT - NATURAL GAS - NEW YORK MERCANTILE EXCHANGE |
| 58 | NO. 2 HEATING OIL N.Y. HARBOR | COT - NO. 2 HEATING OIL N.Y. HARBOR - NEW YORK MERCANTILE EXCHANGE |
| Volatility indexes | ||
| 59 | ISO NEW ENGLAND LMP SWAP | COT - ISO NEW ENGLAND LMP SWAP - NEW YORK MERCANTILE EXCHANGE |
Table 4-3. Instrument list with regualar reports available for a long time
One can see that at present time the Commission collects the data on a wide spectrum the agricultural, currency, financial and other markets. All files described in the table will be received after the run of scripts Meta COT Script Build and Meta COT Script Concatenate.
4.2 Creating research robot
The CFTC reports effectiveness study is a difficult task that
requires real and effective developments in the field of technical
analysis, as well as multiinstrumental optimization. Many of the experienced traders has it, its their
own know-how and are closed. Technical
analysis is wide field, that goes beyond the article, so
we restrict ourselves accessible technical indicators and primitive,
but well-known and technical methods of market analysis.
We will create a simple research decision-making robot for entry into the market on the basis of traders reports analysis. If you are MQL4 developer, you can easily use the CFTC data as an additional filter in your trading strategy based on technical analysis. If you are not a developer, but are interested in this technology, the availability of such robot you will also invaluable.
Using the strategy optimizer it is possible to choose the indicator and its optimal averaging period. The practice shows that for different markets, the most
profitable and accurate indicators are the indicators based on the dynamics of
different groups of traders. Maybe, for some market, the use of the total net position of the unreportable traders will be effecient, for the orther markets the operatiors actions most effective.
So, in the beginning, let us turn to the technical analysis to find the
more accurate entry moments into the market. Larry Williams in his book
suggests to use the classic technical analysis based on moving averages. We will do the same and take to work two simple moving averages, one of
which will be based on long-term trend, the other - on short-term. Long-term moving average, we apply to weekly bars, short-term - to the
daily. The slow average period is equal to the calculation of the
indicator, a fast - is constant and is eqaul to 5 days.
If a slow average current value is greater than its value as two weeks ago, so long-term trend is upward, if less - downward. The same way we will apply to analyze a 5-period moving average: if the current value is more than two days ago, we expected a short-term bullish trend, if less - we are probably in the short-term bearish trend. Once the short-term trend coincides with the long-term, we will stand in their way. We will use one of the Meta COT indicators as a filter. The position will be open only if the indicator will be located in the range of favorable values at present time.
Take a look at Figure 4-2:
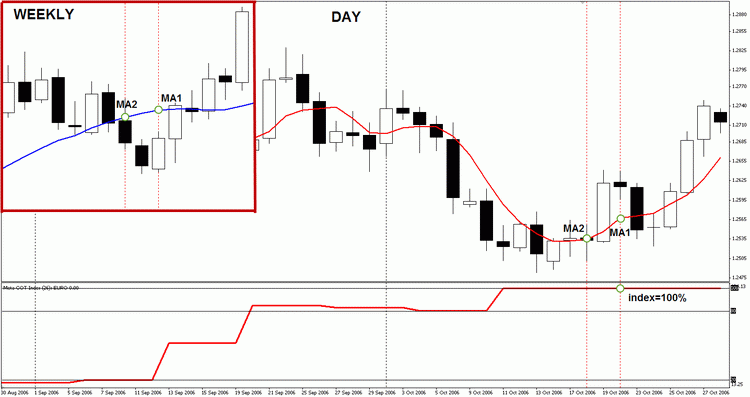
Figure 4-4. Technical analysis signals to open position
At Figure 4.4 a daily chart of EURUSD is presented. The upper left corner shows an excerpt of weekly EURUSD chart for the same period. The long-term simple average (blue line) has the same period that Meta COT Operators Index indicator, in this case is equal to 26 weeks. The short-term average (red line) is always 5-period. We see that on Oct. 15, 2006 the average value of the red (Ma1) was higher than two days ago (MA2), while at the same time, the long-term average value was higher than two weeks ago. Trends are the same, to the same level of the indicator index operators was 100%, to mention a favorable opportunity to buy (or strictly speaking, this condition matched the previous day, but we have used this combination for a graphic illustration)
The robot performs operations using Stop
Loss and Take Profit values (it is the only possible exit points). The
size of the levels depends on the period indicator, the higher period is corresponds to the higher values of stop-loss and take-profit. For every 26 periods of the indicator there is 100 points of loss and 300 points of profit. For example, in such case for the 156 weekly averaging we will use
StopLoss values equal to 600 points and Take Profit of 1800 points
(it's a simple estimation). The specified Take Profit and Stop Loss levels are the only way out of position, so we may
assume that the trading system is fully completed.
The size of the position is fixed and equal to 0.1 of the instrument contract.
The system is not perfect, if not to say primitive. In general, it is a good way to ruin, but things can change, if it is used with Meta COT filters.
Now turn us to the source code of the robot. Its working is very similar to the indicator. The robot is nothing as an indicator of who knows how to put an order. During the initialization the robot loads the data for the current chart (library cotlib.mq4) and then it calculates the values for all of the indicators, and then it gets the value of one of them. The chosen indicator will depend on the indicator_type integer, if we set it to 17, it means that it will use WILLCO indicator for operators, if it is equal to 22, it means the it will be the index of the unreported traders.
It's a simple to find the indicator number, they are listed in the beginning of the cotlib.mq4 library. To define the averaging period, it is necessary to set the period value of the indicator. The chose of the indicators and their periods has been organized by using the Strategy Optimizer. The both values are marked as values to optimize. The period value starts from 26, with step 26 and final value 156. The indicator_type value starts from 16, with step equal to 1 and final value of 26. So, that's way we will try all of the indicators and different periods of averaging:
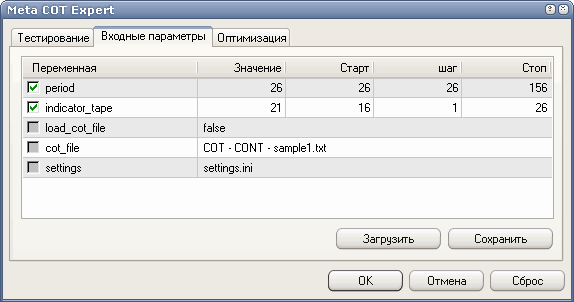
Figure 4-4. Expert input parameters window
Some indicators were not included in the history backtesting. This indicators that do not have clear levels, such as net or absolute position of the operators, as well as indicators of the values of which must be chosen depending on the market, for example the long position of operators divided by open interest. In any case, the indicators are more than enough, to estimate their effectiveness. The strategy considered is too far from perfect to be used to construct a real trading robot. However, the example advisor will help you navigate the mass of information supplied by the project and to find among the proposed methods the most effective. The table 4.5 shows the best test results with indicators are used.
The
results are listed in the table below are rather approximate and the
main purpose of testing to find the most suitable indicator, rather
than to maximize profits. Note that the best result does not mean that
it is the most profitable. The best result was determined by the number
of deals (more - better), by maximal drawdown (less - better) profitability
and, then, the final profit.
In you can perform the backtesting on your computer. The table includes a history backtesting for the following set of instruments:
|
Instrument |
Indicator |
Calc period |
Deals total |
Profit factor |
Math. Expectation |
Drawdown % |
Profit $ |
|---|---|---|---|---|---|---|---|
EURO | Index Operators | 26 | 77 | 1.79 | 62.31 | 12.57 | 4798 |
BRITISH POUND | WILLCO Noncomm | 26 | 140 | 1.44 | 18.64 | 7.12 | 2600 |
JAPANESE YEN | Index Nonrep | 52 | 35 | 1.37 | 63.29 | 14.85 | 2200 |
SWISS FRANK | Movement Index Operators | 26 | 21 | 3.96 | 159.71 | 4.63 | 3354 |
AUSTRALIAN DOLLAR | Index Nonrep | 26 | 59 | 1.98 | 57.50 | 5.67 | 3392 |
NEW ZEARLAND DOLLAR | Index Noncomm | 26 | 20 | 1.97 | 59.00 | 4.13 | 1180 |
US DOLLAR INDEX | Movement Nonrep | 26 | 144 | 1.20 | 1.50 | 1.98 | 216 |
GOLD | Index Nonrep | 26 | 81 | 1.84 | 52.09 | 5.70 | 4219 |
SILVER | WILLCO Operators | 26 | 165 | 1.85 | 26.58 | 4.76 | 4385 |
PLATINUM | Index Nonrep | 26 | 233 | 1.77 | 24.54 | 6.73 | 5717 |
PALLADIUM | Index Noncomm | 26 | 142 | 1.23 | 8.15 | 10.61 | 1158 |
SUGAR | WILLCO Operators | 26 | 18 | 1.89 | 61.22 | 6.67 | 1102 |
COCOA | Index Operators | 26 | 29 | 1.96 | 56.59 | 6.08 | 1641 |
COFFEE | Index Operators | 52 | 113 | 1.38 | 19.58 | 7.59 | 2212 |
OATS | Index Operators | 26 | 15 | 2.24 | 83.50 | 8.25 | 1252 |
WHEAT | Index OI | 26 | 53 | 1.66 | 53.25 | 8.91 | 2822 |
SOYBEANS | Index Noncomm | 26 | 66 | 2.88 | 118.72 | 6.46 | 7965 |
ORANGE JUICE | Index Operators | 26 | 29 | 2.75 | 68.83 | 2.73 | 1996 |
LIGHT SWEET OIL | Index Operators | 26 | 194 | 1.23 | 16.53 | 12.68 | 3206 |
E-MINI S&P | Movement Operators | 26 | 32 | 2.01 | 75.21 | 6.66 | 2406 |
Table 4-5. The best COT filter history backtesting results with fixed lot 0.1
The testing results of the indicators is a very interesting. The first, there is a clear shift to the profitable zone for the Index Nonrep and WILLCO Indicators. The Movement Index indicators behavior is more uncertain. For some of the instruments, it have been achieved a maximum profits (usually an indicator calculated for the operators) for certain values of the same indicator gave a big losses. The use of the Movement Index for non-commercial traders has led to the maximal losses for all of the instruments (point №43 at Fig. 4-6). Perhaps the deeper study of this phenomenon will allow to use its signals.
The optimization chart can be represented as follows:
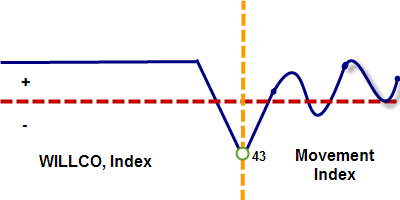
Figure 4-6. The general scheme of the effectiveness of the indicators inspection and their parameters
The red line is corresponds to the zero level of profitability. From the 43 run profits become less stable.
In general, the maximum profit was achieved using with large periods of averaging for the indicators (104-156 weeks), but because of the small number of
deals they were not included in the report. The indicators with a large
averaging period is very accurate, and its use is a very effectively,
especially at dozens of markets simultaneously. Despite of the mirror similarity of the operator and non-commercial traders on some
markets is preferable to use the position of operators on the other -
the position of non-commercial traders. The crowd actions is also interesting.
It is noteworthy that following opposite to the crowd actions brings more profit, than the following to the operators on the gold market
Although
the indicator WILLCO includes Open Interest and it is highly effective, the Open Interest itself is not so effective. At best, its use provides less profit. The IO application is
seen rather as an additional signal, and not as its main source.
In
general, the indicators have proven to be effective, and they,
undoubtedly, will bring a more substantial profit, subject to their
integration into a good trading system.
The typical optimization chart of the EURO, is presented below:
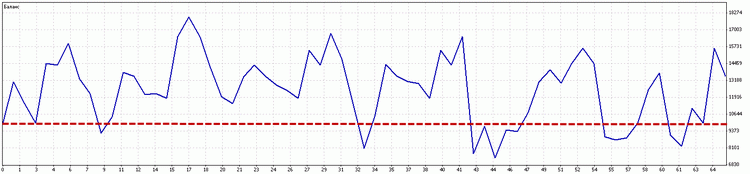
As we see, there is an evident shift to the positive zone (above the red line). Not all of the charts have such effective displacement, and many of them could not be tested properly because of a number of technical reasons.
Now lets compare the effectiveness of filters themselves. For this purpose we will test it on the same price chart with and without COT filters. As an instrument we will use the EURO futures.
The trade result of the trading system without use of COT filters is presented at Fig 4.8:
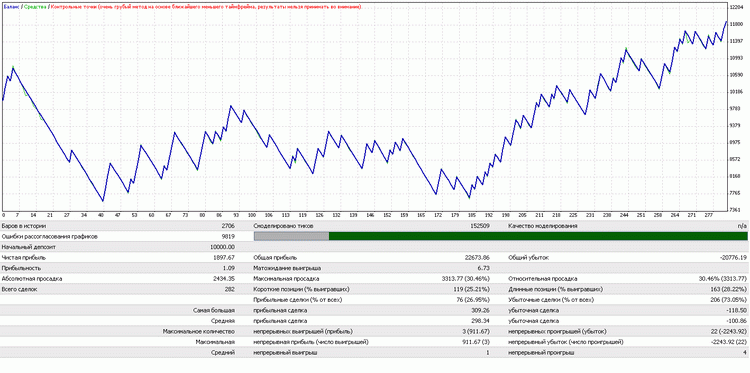
Figure 4-8. The trade results without COT filters
As you can see the final profit was 1,897 USD, which is roughly
equivalent to the same number of points using the 0.1 volume of the lot size. The maximum
drawdown at the same time was 30%, which is undoubtedly very large. Lets take a look at Figure 4-9.
The same strategy, but already filtered with the values of 26-week index of operators:
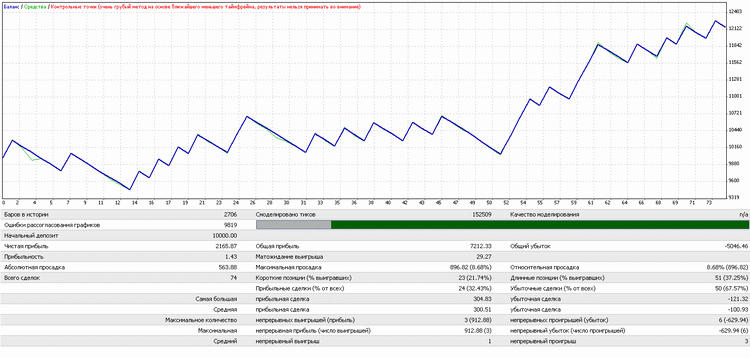
Figure 4-9. The trade results with COT filters use.
As we see, the number of deal has dropped sharply, the mathematical expectation of
winning has increased. The final profit is not much larger than in the first test, but the biggest change occurred with the level of
maximum drawdown. Now it was 8.6% which is much smaller than the
previous version. Undoubtedly, COT filters are effective enough,
allowing to impove the strategy.
To determine the maximum efficiency of use of CFTC information it is necessary to perform a detailed investigations, it is not possible to do it in this article. The main task of the section - to illustrate the basics and using the simple examples to show that the use of the CFTC data can be effective.
Will you follow this method for a real trading or not, depends on you.
4.3 An epilogue with continuation
If you are still have no questions about the subject it may mean that you haven't read the article carefully or does not interested the concept proposed. I hope, that at present time you have a lot of questions, some of the answers can be found below. In fact, its a short FAQ, which can help you to solve many problem using the conception.
1. Should I apply the logic of position opening of the expert described on the practice?
Of course not. Easily you can find a more suitable technique to
determine the accuracy points to enter into the market. Perhaps
you already have your own experience in the field of technical
analysis. Try to apply CFTC filters in its trading strategy. You can add your own position manage technique to the Meta COT research robot.
2. That of the groups positions it is better to observe and follow?
There is no definite answer. Using Meta COT Expert you can find out which group is most
effective in a specified market. Try to use all of the three groups of traders for each market and select the one which gives more accurate forecasts.
3. Which indicators it is better to use?
There is no definite answer. The preliminary tests show that quite a
good choice would be WILLCO or index movement. Again, you must select
this indicator, which the first, would be well correlated with the market and
secondly, is well combined with the use of TS. In any case, a research
robot must determine the most appropriate indicator provided by the trading system the
programming logic.
4. What averaging period is better to choose?
There is no definite answer. Perhaps the best option for a short-term traders will be indicators of 26-period averaging or indicator Movement Index. For traders who want to maintain your position more suitable indicators with a large period of calculation. Most different from the other 26-period calculation. Larger periods do not differ among themselves. Also, do not use the calculation period is less than 26 weeks. Even the semi-annual indicators are highly volatile and excessive turbulence. The optimal time periods can vary from market to market, as well as they should be well correlated with the selected TS. Optimum period of calculation can easily find out through research robot through brute force.
5. What levels of indicators considered critical?
In his book, Larry Williams shows charts with different levels. Some of the graph have the levels of 25 - 75%, the others have
20 - 80%. Perhaps on some of the markets the effective levels are broader, on some they are narrower. In any case, the efficient levels will be in
the range of 0 - 30% and 70 - 100%. You
can use the research robot to determine the optimal levels. Create two variables with the values
of the lower and upper level. Set these variables to optimize. Try to change their values to find the optimal results.
A possible reason for the unusual behavior of a group of traders can be their internal structure and the problems that they solve using the trading on commodity markets. For example, the structure and tasks of hedgers on the gold market may be very different from their tasks of foreign exchange. In any case, you should use the most effective group of traders (see question 2).
7. I want to combine several instruments into one by using the Meta COT
Aggregation, but I am not sure that the union will be correct. How to
check correctly whether I combined the instruments?
First, you need to download the resulting file to some indicator
and to determine visually the values of the market reversal points. The general principle should be maintained: the operators
should have the highest level of sales before the fall of the market
down, the others contrary, must have a possible to buy at this
moment. The mirror the situation should be at the bottom of the market. If the visual checking shows the correct values, then such values it
can be tested in a research robot. If the result is positive and
exceed the result obtained from the use of standard report, the
combine can be regarded as reliable and included it in the trade.
8. The reports don't work on some markets. All of the indicators gives a negative result.
In such markets, try to get use a trading system without CFTC filters. Compare the results. If the system without filters has more bad results than with them, perhaps the system itself has a problem. In this case, you need to imporve your trading system to at least neutral, and then add CFTC filters to it and test again. Try, test and optimize - that a common approach to identifying and solving problems.
9. I can't find the report for the market.
Reports are not for all of the markets. Perhaps the market that you have
chosen does not have the reports collected. Try to find the desired market in the
table presented in the 4 part of the article. If it is not in the table, then most likely
report to it simply does not exist, or they are not complete, so they
can not be used. If the market is defined in the table, look at the
name of the file report, corresponding to it. Load this file to the indicator manually.
You should more carefully read the 3rd part of the article. Most likely, you
have forgot to done something or done it incorrectly. Please read carefully and
try to solve the problem yourself.
The main reason is the report file absence. Verify that the
report file has been downloaded. To do its, open "Terminal", Select the tab
"Log" and download the indicator again. If the indicator didn't find
the report file, you will receive a warning message: "Error downloading the file File_name.scv. Further work is impossible." Go to the \files directory of your terminal and check for the existence of necessary
files. If the file does not exist, delete all of the records using a batch
program erase_cot.bat, then create them again. The required file should
appear.
Most likely, the name of the current tool does not match any of
the reports. Open the file settings.ini and find the report
that should be loaded automatically. If you haven't found the report, create a setting yourself (see section 3.4). Add instument name into file list. Restart
the indicator, it should work.
13. Expert doesn't trade.
A possible reason of this that reports files required for the expert work were not copied to the \tester\files directory. The strategies Tester uses this catalog, so it needs a files to work there. Copy all
the files including configuration file to the \tester\ files directory.
The expert must work.
Sure. The main function that you will need is get_data (int type, int bar). It returns the value of the indicator which specified by the type parameter. The 3rd part of the article has more information about the main code and examples.
15. How to create a portfolio expert?
We haven't provided a multi-instrumental trade. You have to develop your own method for data downloading. Alternatively,
you can apply an ordered file loading, in this case the data can be stored in the separate section for each instrument. But all of this requires further
development.
16. The scripts are runs without the possibility of setting / every time before starting the scripts shows the settings window, although this is not required.
There is a #property directive which defines the call of the settings. If you don't need to change the settings, just comment it. An opposite, if you need to customize settings, remove the comment. And then recompile the
script.
17. Even after reading the article I still have many questions...
You can reread the book Larry Williams, Trade Stocks & Commodities with the Insiders: Secrets of the COT Report for a several times. The CTFC reports analysis is a large topic.
References
2. Stephen Briese. The Commitments of Traders Bible.
3. Campbell R. McConnell, Stanley L. Brue. Economics: Principles, Problems, and Policies, 16th edition
4. Todd Lofton, Getting Started in Futures
5. http://www.procapital.ru/forumdisplay.php?f=267 The topic about CFTC report analysis application (in Russian).
6. http://www.aup.ru/articles/finance/1.htm The concept of risk in economic activity article by Valery Romanov.
7. http://www.timingcharts.com Site with COT charts.
8. http://www.ireallytrade.com Larry Williams's site. It contain a recent information about CFTC reports. On the main page Larry Williams gives an useful advices about the recent trade opportunities.
9. http://commitmentsoftraders.org Steve Briese's site. It's mostly about his book. It contains a useful analysis and additional indicators, basicly in PDF.
10. http://cftc.gov U.S. Commodity Futures Trading Commission site. It contains a recent data about the trader's positions, a main source of information about for COT analysis.
Translated from Russian by MetaQuotes Software Corp.
Original article: http://articles.mql4.com/ru/articles/1573
Translated from Russian by MetaQuotes Ltd.
Original article: https://www.mql5.com/ru/articles/1573
Warning: All rights to these materials are reserved by MetaQuotes Ltd. Copying or reprinting of these materials in whole or in part is prohibited.
This article was written by a user of the site and reflects their personal views. MetaQuotes Ltd is not responsible for the accuracy of the information presented, nor for any consequences resulting from the use of the solutions, strategies or recommendations described.

 Here Comes the New MetaTrader 5 and MQL5
 FANN2MQL Neural Network Tutorial
 MQL5: Create Your Own Indicator
 Step on New Rails: Custom Indicators in MQL5
- Free trading apps
- Over 8,000 signals for copying
- Economic news for exploring financial markets
You agree to website policy and terms of use
Hi! MetaCOT 2.0 is under development. I think it will be done by end of January. You may add me in your 'friends', and monitor all the updatings.
can't wait :)
News of MetaCOT 1.0 and MetaCOT 2.0
MetaCOT 2.0 will be placed on the market in about two weeks. First time all indicators MetaCOT 2.0 will be free. This will make it possible to use MetaCOT 2.0 free for many users. After a while, the indicators will be paid, but will always be not expensive. This will make it possible to support users. But in the strategy tester, you can use MetaCOT 2.0 absolutely free.
After updating MetaCOT 2.0 to MetaCOT 2.1, I always recover MetaCOT 1.0. MetaCOT 1.0 will start again to work in the new build MetaTrader 4. This means that MetaCOT 1.0 will continue to be available for all completely free! But support for MetaCOT will not be provided. So please don't ask me to configure MetaCOT 1.0 on Your PC. Just use MetaCOT 2.0 then.
Some screenshots:
Params of Netto Positions indicator
Open Interest on AUDUSD 1994-2016
GOLD. Non-commercials Operators (mirror mode) and Nonreportable trades
Applying standard indicators to the indicators MetaCOT
Bollinger Bands on Operators netto positions
CotIndex operators (red line, mirror mode) and Non-comm (Blue line). with Open Interest (green dot line). Delta as CotIndex Nonrep. trades
Multiindicators in one subwindow
Watch for updates in this thread, and also add me to your frends. The release of MetaCOT 2.0 will be announced.
Unfortunately, the rules of this forum do not allow to publish news about the products placed in the store. Therefore, the news of MetaCOT 2.0 You can read in my profile.
Hi Vasily,
My question where can I find the JPY information in the indicator? All I got is Euro, Gold and wheat.
you dont put Gold COT?
please add Gold fut GC too