
View of Technical Analysis in the Context of Automatic Control Systems (ACS), or "Reverse View"
Introduction
To get a living, it is sufficient to work.
However, to grow rich, you have to find something else.
Alphonse Karr
(translated from French by MetaQuotes Software Corp.)
If something goes wrong, you should get better, expand your view, look at things differently. This sometimes may bring to very interesting and unusual results. At the first glance, some ideas seem to be absurd... just "by definition". Fortunately, they do that only at the first glance. Indeed, an unprepared person can hardly imagine what happens at, for example, relativistic velocities. The scale is, of course, absolutely, different, but we will sometimes discuss extremes having their practical applications. The most interesting and unusual results are usually obtained when utilizing something "unusual". What is meant here is exactly that "something".
Technical analysis has been successfully developing for many years. The understanding of current processes becomes deeper, more and more complicated properties and laws are used. And, what is more remarkable, they started to speak about fully automated trading systems a while back. At the same time, the automatic control theory and practice go on developing as a scientific and engineering subject.
It is logical that the education and experiences in these two fields suggest the idea of compounding them. A keeping up feeling of superficiality, a wish to strike into the nature of case are good additional stimuli. Most known methods, as complicated they may be, use rather simple properties.
Below is a brief representation of the 1.5-year development in this direction. It is mostly theory and some interesting practical methods. All given below is "field-proven". The purpose was to represent an alternative view. I can provide more details later if need be.
It is interesting that it turned out to be a generalization of the existing laws somewhere, but it is a real "reverse view" sometimes. Of course, we can say the matter is that machines and finances are "apples and pears". However, it seems to me that they still have much in common. Moreover, as to the technical side, the theory itself is developed much more fundamentally, i.e., not as an application in only one field, and much deeper. Such laws are always more reliable. Naturally, the high-level principles can hardly find their applications here. In the technical scope, a huge discretization and spread are rather unpleasant things. The main controlling principle is quite unusual. The question is exactly fundamental laws.
In my opinion, it turned out to be a generalization of all known principles in a larger class of systems and deepening into the part thereof that had not been traditionally touched upon (at least in my practice). This, of course, does not lower the importance of classical methods.
Central Tenets
Nobody should believe to anyone as to the Lord thy God or as to His prophet.
It is sufficient just to listen to a person that makes you think.
Ascribed to Peter Oppenheimer
Classically viewed, the analysis solves the task of predicting and finding the points of entering/exiting the market. When a position is opened, it is accompanied (hedged, etc.). Even this formulation itself implies high discretization and the existence of 'good' and 'bad' movements. The main subject of the analysis is the past, and there is some persistence in decision making.
What will happen to the market, in case the "Holy Grail" is found and implemented worldwide, is another question.
The market movements and their usability are usually related in a very simple manner. For example, on Friday, the 8th of August 2008, most liquid securities fell in price in the Russian securities market on a negative external background. Investors are uneasy.
Moreover, the analysis and decision making often represent two separate systems. An analyst estimates the market situation and proposes his or her recommendations. The whole management is reduced to comparing the analytical data from various sources (including one's own ones), making the decision of opening or closing, and accompanying the position on the basis of further information obtained. No feedback is foreseen, or it is poorly realized due to that the information about the trader's situation seems to be absurd to the analyst. Moreover, the analytical part is distributed and can be changed.
The created constructions (indicators, shapes, etc.), as a rule, are closely related to fundamental market laws. Normally, they are related to the market laws only (psychology, macroeconomics, etc.). There are some more general approaches, like Fibonacci or Elliott. However, many other fundamental laws participate in the work of an ACS (automatic control system).
All above is a historical special case. Everything may go by opposites.
Technical analysis as such is not a simple field, whereas this part thereof (management) is even more complicated. This is partly because it requires deep knowledge and experience in both many technical fields (nonlinear dynamics, computational mathematics, system analysis, theory of probability and mathematical statistics, programming, etc.) and in the field of financial markets, investment analysis, etc. However, the prize is much more attractive, too.
Thus, the monitoring can be practically permanent (discrete, of course, but "always in the market"). It's another matter that the activity can be low most of the time. The relation between the market movements and their usability may turn out to be complicated, highly nonlinear. It is quite optional that the 'good' and the 'bad' (for the system) movements of the market are determined by psychology or by macroeconomic processes (there will be an example given below). There can exist a strong feedback, when the identification of the state includes considering the data about the result obtained.
In the automatic control theory, a servo-type system is standard, i.e., a system that follows up the task. The difference between the task and the current result is inputed to the control system. It would be absurd to use this (as it is) on the market. However, the idea itself finds application here, too.
So, considered from this viewpoint, analysis is permanently related to control. It would be more properly to speak about control that includes analysis. Further, a system is understood to be, totally, the control object, control system and communications. An object is, of course, understood to be an account, but this is performed through the market, by resizing positions. Controlling rates and prices (for example, the exchange rates of one country or of several countries, the prices of the securities of one company or of its competitors, etc.) is a separate topic.
The role of analysis, which consists in prediction, becomes not so important in this context and fully disappears, in extreme cases. Then the main task becomes to answer the question: What should be done in different development variations and what can this result in?
This abstracting results in using some other properties of the market.
Generalization and Extension
You create your own Universe as you go along.
Winston Churchill
The basic equation can be formulated as follows:
y(i+1)=y(i) + (x(i+1) – x(i))*k(i)
where:
y – result,
x – initial chart,
i – step.
It is quite clear. At the 'i' moment, the position is open with the amount of lots equal to k(i). Therefore, the result changes in proportion to that. I've not considered spread yet. It can be written as follows, too:
dy(i)=dx(i)*k(i)
k(i) has also the sense of speed. Actually, there can be many choices for k(i).
It could seem: What else can be invented here? For example, this equation is just a transformation from one chart to another. The resulting chart is usually taken as equity (again, spread is not considered here). This is not necessary so. For an open position, the resulting chart repeats the initial one as a weighted one, i.e., their properties can be practically corresponding with each other. We can take the resulting chart as an initial one and process it again. Thus, this system can be multilevel, while spread becomes considered only at the last level. At each level, you should keep and add the necessary properties and delete the unnecessary ones.
If an idea or a trading system is tested and the test result does not satisfy you (large drawdowns, very instable profits, etc.), you can, of course, try to improve the system. However, this chart may be better than the initial one and worth to be processed at a higher level. It is not the fact, of course, but it can often turn out to be so.
I recently conceived the idea of that it would be possible to work on the others' equity charts in a similar way. This opens a variety of interesting opportunities. However, this matter is closely related to the development of the investment market, trust management, etc. Well, this is another pair of shoes.
This was vertical complication, or consideration into the depth. It is also possible to consider everything horizontally, if we use several parallel systems. In the simplest case, the one system compensates the disadvantages of the other. The idea is by far not new. It's another matter if they are interrelated. Among other things, such systems must be synchronized due to the presence of discretization and spread. This will be considered at the end of this present article.
In a general case, the main equation is transformed into a combined equation:
dy1(i)=dx(i)*k10(i)+dy1(i)*k11(i)+dy2(i)*k12(i)+…
dy2(i)=dx(i)*k20(i)+dy1(i)*k21(i)+dy2(i)*k22(i)+…
...
In my practice, it happened that there were over one thousand systems horizontally and over ten levels vertically.
Vertically, the real system is only the last system (position size or speed are multiplied on all levels). Horizontally, any systems may be real. It means that some systems can be used as internal, auxiliary or fake systems. They provide a much greater flexibility. The useful properties show, for example, when such a system acts under the laws of a real one, but with a small deviation, and is actively present in the operations of other systems at the same time. For example, if there is a real system that controls it.
Eventually, parallel systems are added (or subtracted), so everything can be reduced to the first basic equation.
If two systems are added and if we subtract a part from the result of the first system and add that part to the result of the second system, then the sum will remain the same and such an operation is quite allowable. At the first glance, there is no reason for doing this, maybe only if there is no feedback. However, if the further conduct of the system depends on its current situation, this method may turn out to be most welcome (an example will be given below).
Now a few words concerning chart transformations. If the chart moves up, it is good. If it moves down, then we can always change it, and it will move up again. We can easily decrease the deposit only using a spread or the deposit scarcity, although other ways may also exist. Or the task is reduced to that of increasing the deposit.
If the chart is fluctuating, it is often possible to turn it to a directional movement. It depends of the movement property. I like it better to reduce to such form first and then to work with it.
These are well-known trend and nearly flat markets. In practice, naturally, everything is much more complicated: there are many frequencies there, including the low ones.
A useful feature: Any chart can be reduced to one of two forms. It's another matter that the properties obtained may be not very attractive: The trend movement may have short but large drawdowns, while the fluctuating movement may sometimes have too large random amplitude. But these disadvantages appear if you use a brute-force approach. However, the fact of this opportunity, as such, is useful.
Another useful note is that no limitations related to spread or the deposit scarcity are valid in the intermediate, internal charts.
The market carries a large part of uncertainty in itself. This uncertainty usually also passes to your equity due to the methods used and to the closeness of the initial and the resulting chart (one level). The meaning of all these transformations consists in that you change the chart properties consecutively at each level in order to reduce the uncertainty.
Some Techniques
Who knows how many words the God had tried, before He found the one that could create the world.
Ascribed to Stanisław Jerzy Lec
All techniques described here are just possible tools that cannot work independently, but they can find their applications in various combinations with each other in compound systems. They are written as examples that represent rather extreme cases. There can be much more between the extremes, though.
Servo-Type Systems
Strict feedback revisited. The simplest example (the solution does not depend on the movement of the initial chart):
dy(i)=dx(i)*(y - g)*m
where:
m – coefficient, a constant, in this example;
g – task that can be a constant, but it can also be a variable.
On the other hand, g is an attractor (a simple one, though there can occur complicated ones, too), i.e., it is a state the system is attracted to by the down-trend or by the flat market. It is also the point of possible bifurcation, i.e., of multiplied further movement directions, if we don't allow the system to hold at this point. If the chart is moving up, the system tends to leave its stable state in the direction to the position where the resulting chart was when it had started moving.
There can be many variations here.
If g is a constant, the system is attracted to this position, and only specific measures can get it out of there. For example, exchange with other systems (this is an example why it may be necessary), setting it as a sine curve with a small amplitude or as follows:
dy(i)=dx(i)*|y – g|*m + c
where:
c – some constant.
If c is positive, there are no equilibrium states; if it is negative, then there are two of them: above and below zero. You cannot create an oscillating system with a limited amplitude using the negative 'c', because of sticking at the boundaries. Where c is a positive number, the amplitude is not limited and often turns out to be too large. However, all this depends on what the given system is working at and what additional techniques are used. However, as a whole, the situation is as described above.
All this applies to a wide range of servo-type systems, to its oscillatory part. Its standard appearance is approximately as follows:
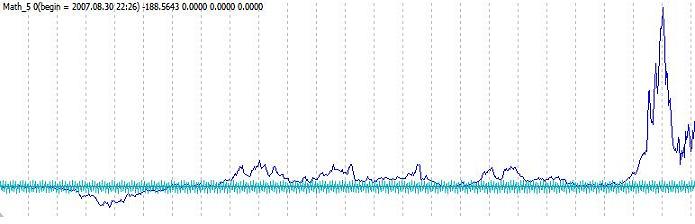
Another example, where the task is not a constant and, for example, moves up linearly. Then the system follows the task most of the time, never exceeds it, but has huge drawdowns. If you place TakeProfit and StopLoss, then the long-term resulting direction depends on volatility and on trends. In any case, if we make a reverse, we will obtain a drawdown-limiting technique. Standard appearance:
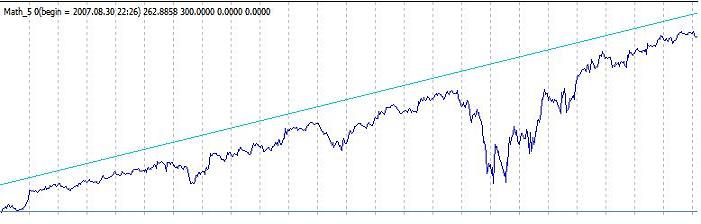
Task can be selected in a more complicated way. We can take, for instance, the initial chart itself or the chart of another system. Then the result follows the task quite well. If we find the difference between the initial chart and the result, we will obtain one more oscillating system. There are many variations here, too.
It would a be a good direction of work: Let the task move linearly. Then we can use various techniques (for example, exchange between the initial chart and those following it up) trying to increase the probability of the movement from the task. Most of the time, the system moves exclusively in one direction, but it is compensated by rare but strong opposite movements. The problem is only that they are rare. Then we can try and create several parallel system of this kind, based on different initial charts (other currency pairs, different pre-processing or by the technique described below and based on random processes). We should also add here synchronization to compensate drawdowns and spreads.
Drawdown limitation can be an extremely useful property.
Another solution would be to use two or more practically identical systems. They all work under the same laws, but with small deviations in form of an introduced random signal, for example, through speed. The systems must tend to the same value. Then, in the task area, the deviations between them tend to zero. Subtracting one system from the other, we can obtain the result of introducing the random signal. It turns out not to be quite random, but the idea is not bad, as a whole.
Servo-type systems can be used for the opposite purpose, setting by the task a boundary the system must not exceed. Then, if we have protected it against sticking, then the system will oscillate only on one side of the task.
Data Exchange
Let's return to a simple variation. If we add a minus to it:
dy(i)=-dx(i)*(y - g)*m,
then no opposite chart will be obtained. Just the actions of trends will replace each other. Should the first system (with plus) decline from zero, the other one will approach to it, and vice versa. The flat market will act in the same way.
We can complicate it a little. Let's add such a data exchange:
dy1(i)=dx(i)*(k1*y1 + k2*y2 – g)*m,
dy(i)=-dx(i)*(k2*y1 + k1*y2 – g)*m,
If k1 = 1 and k2 = 0, then we obtain two separate considered systems.
If k1 > 0.5 and k2 < 0.5, then the systems converge, too, but a bit slower (correspondingly, the oscillation amplitude is smaller).
If k1 = 0.5 and k2 = 0.5, then we obtain an analog of self-oscillations. The speed depends on g. If g is a sine, the speed will be a sine, too. It must not oscillate about zero.
If k1 < 0.5 and k2 > 0.5, then the system diverges. It is still oscillating about zero, but its amplitude increases with acceleration (most probably, also with higher derivatives). I.e., if the ratio between the amplitudes of neighboring oscillations could be a bit more than one at the beginning, it is counted in hundreds later. Its typical appearance (the system consists of two subsystems, as given in the formula):
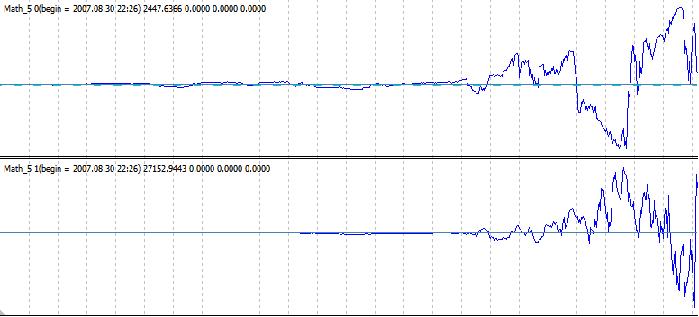
To start, you can use a sine as a task, though it is reasonable only at the very beginning. You can simply set the initial value of the result of one of the systems, other than zero. It will never converge anymore: the situation of (y1=0, y2=0) is automatically avoided.
In the movement itself, there are some other useful properties.
The main advantages are oscillation about zero and divergence.
The fact of instability itself (the ratio between amplitudes is more than one) can be very useful. Besides, look at the first basic equation. It is very interesting that such a simple transformation (with k1 and k2) changes the chart so significantly.
Of course, this movement is very difficult and hardly controlled. Here we can speak about the art of management. I've made a certain headway in such processes, but the things have not come to real systems here yet.
Backward Transformation
If a forward transformation is possible, then a backward one is possible, too (in these conditions):
dy(i)=dx(i)*k(i),
dx(i)=dy(i)/k(i).
We can first make a forward one (for example, for the oscillating variation), correct it using one more transformation, and then apply a backward transformation to the new chart as to the previous one. Then we will obtain a modified initial chart in the direction we need.
It should be repeated that most of these transformations are internal. It means that, eventually, neither large drawdowns nor reckless speeds will pass. A diverging chart can be limited by two levels above and below zero. It will oscillate and finally comes to one of them. As such, it doesn't produce much sense, but it suits as an example of limiting. Very strange and, at first sight, unusual processes may take place inside, but not outside. It is like a ballistic rocket that took off from the Earth and landed on the Earth, and used the advantages of its distance from that Earth on its way.
Random Processes
By the way, about the space. We can abstract away from the market even more using random processes, without losing generality. The first transformation will appear as follows:
dy(i)=dx(i)*k(i)
where
k(i) – a random (pseudo) number. For example, from -1 to 1. I prefer to use a discrete variation: either 1 or -1.
Only volatility come to result. Practically everything else is random. Some properties of the initial chart in the periods between decision makings pass, too. We can, of course, add randomness in smaller scales, the the situation becomes mixed.
The notions of the 'good' and 'bad' movements of the initial chart strongly change here.
Of course, the properties of a chart change.For example, a system that sells at an up-movement by 20 points (the speed of -1) and buys at a down-movement usually wins approximately the same at a long period as it loses on spreads. This won't happen with such a chart.
There are problems related to volatility that, in its turn, is related to the discretion of decision making, spread, and other factors of the kind. However, there are some limited ways to smooth and increase persistence, which improves the situation to some extend.
Generally, the following question arises quite logically: Is it, in principle, possible to successfully manage such a process? Wouldn't it be so that on a large time interval, the probabilities of winning or losing the same amount of points would be fifty-fifty? It wouldn't, perhaps. For example, there is such function as module. Purely mathematically, a random chart is always above zero. It wouldn't probably work as you wish, but this is determined not by the chart alone. I.e., the problems here are not strictly related to randomness. However, this produces a great variety of limitations that pay, in my opinion.
Advantages. First of all, abstractness. You aren't touched by any crises, it makes no difference to you where the initial chart moves and how it does it. A crisis can, of course, occur without visible causes, this must be taken into consideration. In this case, it is easier to consider this using a bit different working principles.
Second, you can make as many initial charts as you wish. As in the example above: Let you have a system that gradually moves down, while a rare but strong up-movement compensates the drawdowns. Then, having a large amount of systems of this kind and correctly synchronizing them, we can get the summarized result in a more standard appearance. A successful parallel working of systems with other properties is possible, too.
Third, risks are essentially reduced. Trading can be modeled for up to 1000 years in advance.
Continuous switching that means that spread is a semblant problem. It needs the synchronization of a large number of systems. You can always 'freeze' a part of systems for one or two periods so that the after-adding speed does not differ very much from the preceding one. The main thing is not to overplay. You can do so that the speed is always equal to one or zero. There is no sense in in, though. Additional conditions like prioritizing the 'freezed' systems and other techniques will make the speed less oscillatory, but will not significantly affect the availability of the system.
there are two serious disadvantages, as well. The first one concerning volatility and discretization is describede above. The second one is the probabilities of the resulting chart moevements. It is difficult to shift them into the range of values appropriate for working with them. The situation can be improved due to some methods that allow you to increase your profits significantly if the system is just a bit profitable. However, those critical values are mostly determined by the development of the methods.
Some words about the discretization of decision making. By the way, it may sometimes help. I often check all systems on a strict period of 1.5 hours. Then I make corrections to adjust it to the system's properties and make it change according to the situation. It is better to attach the moments of possible speed changes to some discretion, except for extraordinary occasions. This will help to reduce losses on spreads, because, if there are many parallel systems working simultaneously, their speeds are eventually summed, and the summed losses turn out to be much smaller than the sum of losses of individual systems.
Such techniques as TakeProfit and StopLoss, as a rule, are better to be used at the last levels. At the first stages, it would be better to use continuous transformations.
Well, finally, watching the activities of such systems from 'outside', it is extremely difficult to have an insight into their operation logic. Especially, if there are random processes inside.
Conclusion
It is our often practice to estimate the accomplishments of science by its practical results only.
So it turns out that he who picks the apple is the person who has done the main work,
when, in fact, the apple is made by him who has planted out an apple tree.
P.L. Kapitsa
Here I have shown some extreme cases (the use of feedback only, the use of pseudo random charts, etc.), that turn out to be quite viable. If even they produce so many opportunities, then there much more intermediate variations. This gives a huge flexibility, there can be a large amount of various choices. What I have shown here is just a small part of what can be really done.
I didn't write about various small features we cannot do without, in such extreme cases. For example, if parameters are not set very accurately or no special measures are foreseen, then the discretization may result in that a servo-type system exceeds its task (which has not been foreseen) and moves to a large distance from it. However, that boundary might be determining a drawdown. It shows up especially well when working with diverging processes.
Amid the developments of information technologies, increased liquidity and reduced spreads and commissions, such methods can gain in importance.
Of course, it's not very easy to work with such things, but the prospects are not bad. All this often seemed impossible. This doubting resulted in changing viewpoints, finding new opportunities, principles, techniques. Fortunately, appearances are all for us. I cannot say that I have already made great advances. 1.5 years are not a really large period for these things (complicated, as they may seem). Most of time, it was just a hobby for me. However, this hobby is now tending to become my professional activity after the first positive results obtained. By the way, I'd love to work on all this in a team. It is another pair of shoes, though. Let's work, create and become better all the time.
Best wishes.
Translated from Russian by MetaQuotes Ltd.
Original article: https://www.mql5.com/ru/articles/1555
Warning: All rights to these materials are reserved by MetaQuotes Ltd. Copying or reprinting of these materials in whole or in part is prohibited.
This article was written by a user of the site and reflects their personal views. MetaQuotes Ltd is not responsible for the accuracy of the information presented, nor for any consequences resulting from the use of the solutions, strategies or recommendations described.
 To Sleep, or Not to Sleep?
 Idleness is the Stimulus to Progress. Semiautomatic Marking a Template
 Visual Testing of the Profitability of Indicators and Alerts
 HTML Walkthrough Using MQL4
- Free trading apps
- Over 8,000 signals for copying
- Economic news for exploring financial markets
You agree to website policy and terms of use