VaviStar retracement indicator
- Indicadores
- Versión: 1.41
- Actualizado: 25 enero 2023
- Activaciones: 5

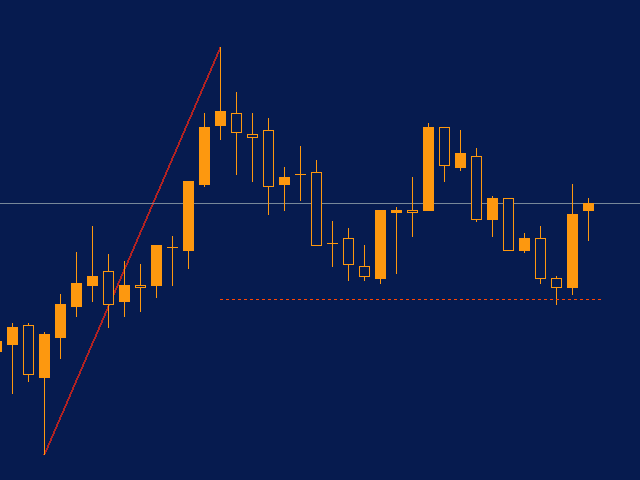
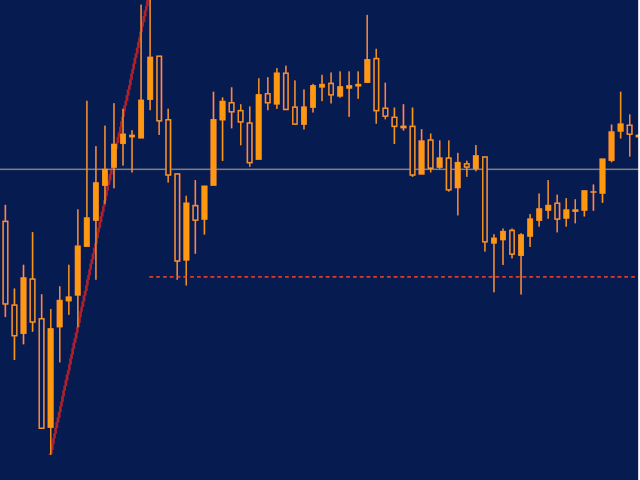
VaviStar es un indicador basado en retrocesos de tendencia determinados por segmentos ZigZag.
Se teoriza, y las estadísticas lo confirman, que las acciones reaccionan a ciertos niveles de retroceso. Muchos utilizan los niveles de retroceso de Fibonacci (23,6%, 38,2%, 61,8%).
Se supone que una vez que el precio supera el retroceso del 61,8%, ya podemos hablar de un cambio de tendencia.
Este indicador permite trazar cómodamente un segmento del ZigZag con los niveles operativos relativos elegidos.
Con una mentalidad de inversión, se puede utilizar para operar entre los niveles de stop loss y de retroceso (quizás el 61,8%).
Con una mentalidad de seguidor de tendencia, se puede buscar un reinicio tras rebotes en el nivel de retroceso (quizás 23,6% o 38,2%).
Para este tipo de estrategias, es aconsejable desactivar la visualización del nivel de Stop Loss.
Uso en tiempo real.
Si evaluamos el segmento actual y si "show StopLoss line" a "true", se nos actualizará tick a tick si el objetivo sigue contemplado por estar aún más cerca que el nivel de retroceso.
Gráficamente, se señalará el último segmento generado y se actualizarán los niveles relativos con cada cambio de cotización.
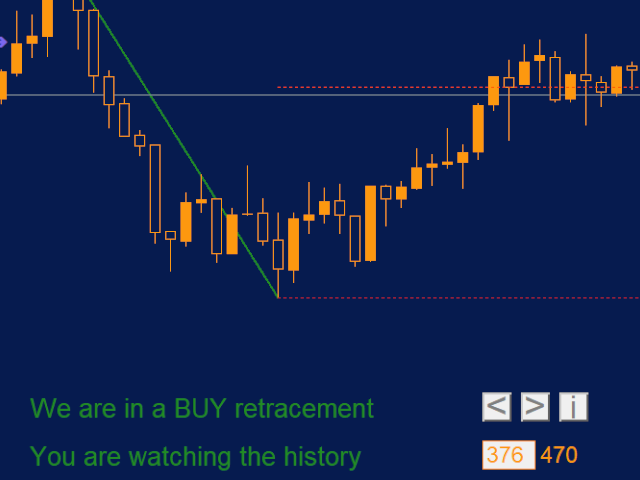
Uso histórico.
El indicador es perfecto para realizar búsquedas históricas. Con la botonera y los botones "<" y ">" podemos desplazarnos por todos los segmentos y comprobar cómo hubiera funcionado nuestra estrategia o podemos ir en busca de niveles clave.
Podemos utilizar diferentes marcos temporales para encontrar niveles de soporte y resistencia.
En el historial, en función de cómo coloquemos el ratón en el gráfico (apuntando al punto potencial de entrada en el mercado y en función del stop loss - si "show StopLoss line" a "true") se nos notificará dónde se habría colocado el nivel objetivo.
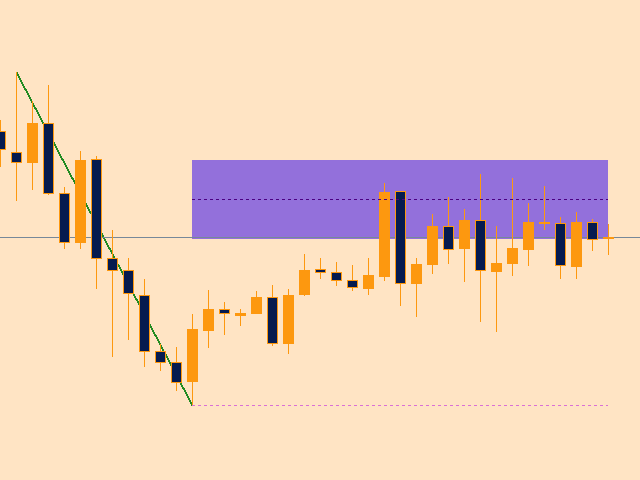
Desplazando hacia atrás el gráfico también nos permitirá ir y encontrar niveles de precios nunca alcanzados y nunca tocados. Dejando los parámetros por defecto podemos encontrar aquellos que podríamos comparar con POCs. Me explico, los POCs (punto de control) se deducen de volúmenes fuertes; con VaviStar no usamos volúmenes sino niveles que, estadísticamente, hacen reaccionar al precio.
Personalización gráfica.
Además de los colores, será posible personalizar la posición de todos los elementos.
Parámetros de entrada:
Parámetros ZigZag
ProfundidadZZ: Sirve para ajustar el parámetro "Profundidad" del ZigZag;
ZZ Desviación: Sirve para ajustar el parámetro "Desviación" del ZigZag;
ZZ Paso Atrás: Permite definir el parámetro "BackStep" del ZigZag;
Parámetros de la estrategia
Retracement %: Se utiliza para establecer en qué porcentaje de retroceso se espera una reacción del mercado;
Mostrar línea de Stop Loss: Si se establece en "true", la línea Stop Loss se dibujará a partir del extremo derecho del segmento ZigZag;
Desplazamiento StopLoss: Permite establecer a cuántos puntos de distancia se situará la línea de Stop Loss con respecto al máximo y mínimo indicados por el segmento Zig Zag;
Multiplicador de rendimiento: Sirve para fijar el objetivo en función de la distancia del Stop Loss;
Parámetros gráficos
Tamaño de letra: Permite definir el tamaño de la fuente; de este parámetro depende el tamaño de todos los elementos gráficos;
Distancia X línea 1: Permite definir la distancia de la línea de texto 1 respecto al eje de ordenadas;
DistanciaY línea 1: Permite definir la distancia de la línea de texto 1 respecto al eje de abscisas;
Distancia X línea 2: Permite definir la distancia de la línea de texto 2 respecto al eje de ordenadas;
DistanciaY línea 2: Se utiliza para establecer la distancia de la línea de texto 2 desde el eje de abscisas;
Color texto si BUY: Sirve para fijar el color del texto en situaciones alcistas;
Color textosi VENTA: Sirve para fijar el color del texto en situaciones bajistas;
Color líneaStopLoss: Sirve para fijar el color de la línea que indica el nivel de Stop Loss;
Color de la línea deRetracements %: Se utiliza para establecer el color de la línea que indica el nivel de retracement;
Color de la línea objetivo: Permite definir el color de la línea que indica el nivel objetivo;
Color del texto deedición: Permite definir el color del texto de la ventana de edición;
Mostrar área: Si es verdadero, se dibujará un área alrededor de la línea de retroceso;
Ancho delárea en %: Permite definir el ancho, expresado en porcentaje, del área alrededor de la línea de retroceso;
Color del área: Se utiliza para establecer el color del área alrededor de la línea de retroceso;
Distancia X Botones: Permite definir la distancia de la botonera respecto al eje de ordenadas;
Botones Distancia Y: Permite definir la distancia de la botonera respecto al eje de ordenadas.
Para cualquier información o sugerencia operativa, escríbanos a info@followthegainstar.com.