VaviStar retracement indicator

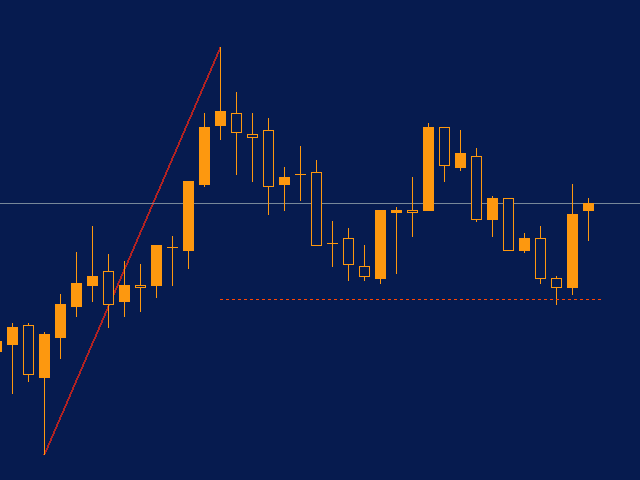
VaviStar is an indicator based on trend retracements determined by ZigZag segments.

It is theorized, and statistics confirm, that stocks react to certain retracement levels. Many use Fibonacci retracement levels (23.6%, 38.2%, 61.8%).

It is assumed that once the price goes beyond the 61.8% retracement, we can already speak of a trend reversal.

This indicator allows you to comfortably chart a segment of the ZigZag with the relative operating levels chosen.

With a reversal mindset, you can use it to trade between stop loss and retracement levels (perhaps 61.8%).

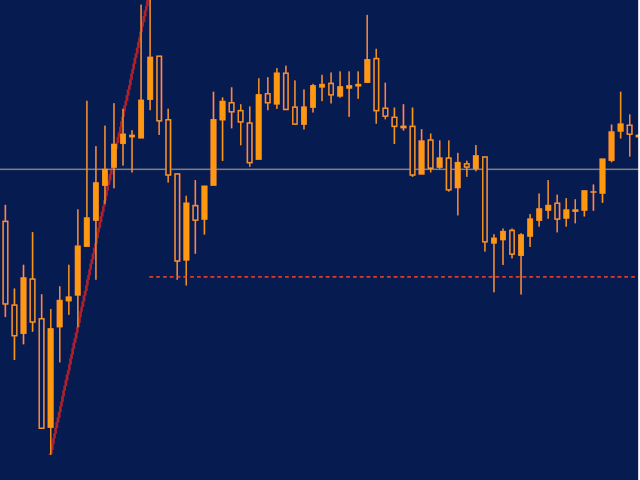
With a trend follower mentality, one can look for a restart after bounces off the retracement level (perhaps 23.6% or 38.2%).

For strategies like these, it is advisable to deactivate the display of the Stop Loss level.


Real-time use.

If we evaluate the current segment and if “show StopLoss line” to “true”, we will be updated tick by tick if the target is still contemplated as it is still closer than the retracement level.

Graphically, the last generated segment will be pointed to and relative levels will be updated with each quotation change.
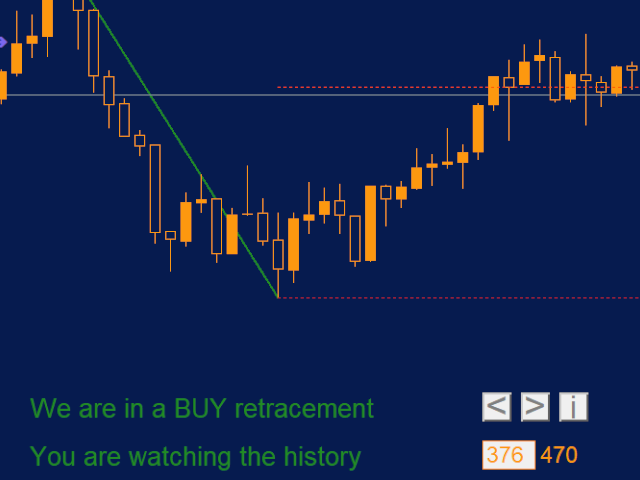

Historical usage.

The indicator is perfect for searching history. With the push-button panel and the “<” and “>” buttons we can scroll through all the segments and check how our strategy would have worked or we can go in search of key levels.

We may use different time frames to find support and resistance levels.

In the history, based on how we place the mouse on the chart (aiming for the potential market entry point and based on the stop loss - if "show StopLoss line" to "true") we will be notified where the target level would have been placed.

Scrolling back the chart will also allow us to go and find price levels never reached and never touched. Leaving the default parameters we can find those that we could compare to POCs. Let me explain, POCs (point of control) are deduced from strong volumes; with VaviStar we do not use volumes but levels that, statistically, make the price react.

Graphic customization.

In addition to the colors, it will be possible to customize the position of all the elements.


Input parameters:

ZigZag parameters

ZZ Depth: It is used to set the "Depth" parameter of the ZigZag;

ZZ Deviation: It is used to set the "Deviation" parameter of the ZigZag;

ZZ BackStep: It is used to set the "BackStep" parameter of the ZigZag;

Strategy parameters

Retracement %: It is used to set at what retracement percentage a market reaction is expected;

Show Stop Loss line: If set to "true", the Stop Loss line will be drawn starting from the right end of the ZigZag segment;

StopLoss Shift: Used to set how many points of distance to place the Stop Loss line with respect to the maximum and minimum indicated by the Zig Zag segment;

Yield multiplier: It is used to set the target based on the distance from the Stop Loss;

Graphic parameters

Font size: It is used to set the font size; the size of all the graphic elements depends on this parameter;

Distance X line 1: It is used to set the distance of text line 1 from the ordinate axis;

DistanceY line 1: It is used to set the distance of text line 1 from the abscissa axis;

Distance X line 2: It is used to set the distance of text line 2 from the ordinate axis;

DistanceY line 2: It is used to set the distance of text line 2 from the abscissa axis;

Text color if BUY: Serves to set the text color in bullish situations;

Text color if SELL: It is used to set the text color in bearish situations;

StopLoss line color: It is used to set the color of the line indicating the Stop Loss level;

Retracements % line color: It is used to set the color of the line indicating the retracement level;

Target line color: It is used to set the color of the line indicating the Target level;

Edit text color: It is used to set the color of the text in the edit window;

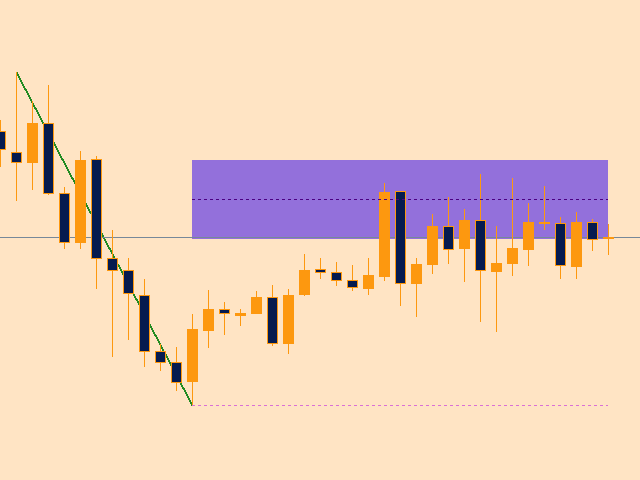
Show area: If true, an area will be drawn around the retracement line;

Area width in %: It is used to set the width, expressed as a percentage, of the area around the retracement line;

Color area: It is used to set the color of the area around the retracement line;

Distance X Buttons: It is used to set the distance of the push-button panel from the ordinate axis;

Distance Y Buttons: It is used to set the distance of the push-button panel from the ordinate axis.


For any information or for further operational suggestions, write to us at info@followthegainstar.com.

Produtos recomendados
Smart Pivot Points para MetaTrader 4 — Níveis Claros para Negociações Inteligentes O Smart Pivot Points é um indicador profissional para o MetaTrader 5 que calcula e exibe automaticamente um conjunto completo de níveis de negociação chave no gráfico. Transforma o caos da ação do preço num mapa estruturado e claro, destacando zonas de suporte, resistência, equilíbrio de preços e potenciais alvos. Concebida para traders que valorizam a clareza, a ferramenta funciona em qualquer mercado: Forex, cr
Fibonacci Trend Marker   — is a trend indicator that analyzes the behavior of the current candle relative to the High-Low (HL) range of previous candles using Fibonacci retracement levels. It visually tracks trend strength, signaling potential weakening or reversal through a change in candle color. Features: Designed for trend-focused traders, it helps quickly identify trend changes based on Fibonacci levels. Effective on any timeframe with sufficient market volatility, when a sequence of 3–5 c
Auto AndrewFork
Noor Ghani Rahman
1 (1)
Auto Pitchfork Indicator The indicator calculate the Pitch fork for the previous Day (Selectable) with multiple Support and Resistance lines from the Median price which acts as Magnet for the Price that if price touch the above warning (1) or below warning (1) lines and not cross up or down then there is maximum possibilities that it will return to the Median Line, and thus maintain the Price Action in Cyclic Pattern to the Market Move. You are able to select how many warning lines you want to k
Possible Price reversals levels - based on  Fibonacci + Support +  Resistance Levels Auto levels drawn based on input index (Bars Count )  ---->>> Price Over 50% Fibo line ---> UP TREND ---> BUY when price drop near Support Lines  ---->>> Price Down 50% Fibo line ---> DOWN TREND ---> SELL when price goes up  near Resistance Lines  --->>> The more close price levels ----> the more possibility for price reversals --->>> are you a scalper --> try it on M1 charts with big index like 5000 bars  or
UPD1 Fibo Levels
Vitaliy Kuznetsov
5 (3)
O indicador analisa o número especificado de velas e traça os níveis de Fibonacci com base no máximo-mínimo. Como os níveis estão se reorganizando, estamos interessados ​​no lado direito da faixa. Os ímãs de preço aos níveis e reagem ao toque. Use esta ferramenta para encontrar um ponto de entrada de tendência após uma correção. Se à esquerda vemos que os níveis aumentaram perfeitamente, podemos supor que encontramos o fim do movimento no ponto extremo. Todas as linhas são desenhadas por meio de
FREE
Fibonacci Wave Bands Indicator The Fibonacci Wave Bands indicator utilizes Fibonacci ratios to create dynamic bands around a central moving average. These bands are derived from key Fibonacci ratios (typically 38.2%, 50%, 61.8%) and adapt to market volatility, offering insights into potential support and resistance zones. Key Features: Fibonacci Levels: The indicator plots multiple bands above and below a central moving average based on Fibonacci ratios. Dynamic Support and Resistance: Bands ser
Fibonacci Sniper
Elmira Memish
3.67 (3)
Fibonacci Sniper MT4 - No Repaint Features:  - Indicator sends signals and notifications on key Fibonacci Retracement and Fibonacci Extensions Levels - Once the buy/sell signal is set, targets ( TP1 TP2 TP3 )and stop loss levels are drawn by the indicator. - Fibonacci Calculations and Custom Patterns are identified by the last 3 or 5 Zig Zag exterum. - You can easily identify key harmonic patterns like Gartley, Bat, Butterfly and Crab patterns. Important Settings:  - Choose the Zig Zag Set
BeST_Fibonacci Retracement Lines is an MT4 Indicator that by default is based on common  Fibonacci levels but it can also draw any 3 desired levels of Retracement or Support of a trending move. It can be used to identify pullback points but also additionally as a kind of a Trailing Stop . BeST_Fibonacci Retracement Lines indicator: • by default draws 38.2%, 50% and 61.8% Retracement Levels of the current price move defined using the Highest High (HH) and Lowest Low (LL) of a desired Look Back Pe
Pulsar V
Dmitriq Evgenoeviz Ko
PULSAR X — Gold Market Momentum Monitoring The XAUUSD market doesn't forgive simple decisions. High volatility, false breakouts, and aggressive reactions to news make classic indicator-based strategies vulnerable. PULSAR X is a next-generation algorithmic system designed to accurately operate in market congestion and impulse exhaustion conditions. This is not a trend bot or an averaging mechanism. PULSAR X analyzes the moment when crowd pressure loses its force and the market moves from chaos t
Convenient drawing of parabolic channels by four points (two lower and two upper extremums). Additional control keys: N (New) - Start drawing a new channel. C (Clear) - Deletes the current channel. By default, the current channel is the last channel. But you can click on the line of any channel to make it current. Click on the gear in the upper right corner to set some parameters for all channels or the current channel. All work is visible from the animated Gif. Channels are saved when the time
FREE
TradingView Style Chart Watermark Transform your MetaTrader 4 charts to look as elegant and professional as TradingView. Are you tired of the default, plain look of MetaTrader? WaterMark MT4 is a lightweight, fully customizable indicator designed to enhance your charting experience by adding sleek, modern watermarks directly to your trading terminal. This indicator bridges the visual gap between standard MetaTrader charts and premium web based charting platforms. It allows you to display the cur
FREE
Pivot levels Auto V1
Hafis Mohamed Yacine
What Is a Pivot Point? A pivot point is a technical analysis indicator, or calculations, used to determine the overall trend of the market over different time frames. The pivot point itself is simply the average of the intraday high and low, and the closing price from the previous trading day. On the subsequent day, trading above the pivot point is thought to indicate ongoing bullish sentiment, while trading below the pivot point indicates bearish sentimen How to Use Pivot Points The very ess
SRP (Strong Retracement/Reversal Points) is a powerful and unique support and resistance indicator. It displays the closest important levels which we expect the price retracement/reversal! If all level are broken from one side, it recalculates and draws new support and resistance levels, so the levels might be valid for several days depending on the market! Key Features You can use it in all time-frames smaller than daily! Displays closest significant support and resistance levels Update the le
FREE
The SFT Fibo Smart Pivot indicator is a powerful trading tool based on the Fibonacci Golden Ratio, designed to identify key support and resistance levels in the forex market. This indicator has the ability to pinpoint significant price levels that can serve as entry and exit points for trades. It enables traders to analyze the market more effectively and make well-informed decisions. The indicator uses the Fibonacci Golden Ratio to accurately determine support and resistance levels. These levels
FREE
Automatic Fibonacci  is an indicator for automatic Fibonacci Levels drawing. It is fully customizable by user. User can also select different Fibobonacci Levels by user settings or can use multiple Automatic Fibonacci indicator in one chart. All details can be found >>HERE<< Instructions Move Indicator to the chart (simply drag and drop) When pop up window appears select desired settings. Confirm settings and enjoy the Automatic Fibonacci indicator. Features Any chart Any time-frame Custom
XFibo Auto Fibonacci
Welinton Dos Reis Goncalves
5 (1)
Use with disciplined risk management. Fibonacci entry system based on the golden zone 38.2 - 61.8 where the entry is confirmed at 23.6 with indications of Take Profit 3:1. Automatically plotted Fibonacci contains retracement and expansion Fibonacci in a single indicator. Up to 77% win rate with this system. FTMO challenge pass with 0.50% risk and 1.50% R:R.
Ratio market
Aleksandr Krokhalev
4.33 (15)
Volatility under control. The indicator shows the optimal depth for setting goals within the day and on the average trend. It also builds pivot zones for the estimated correction depth. As an accompaniment, the key levels of the structure are displayed for several timeframes. Classical volatility indicators ATR & ADX on fixed timeframes are used for calculation. The calculation takes into account the spread, and if the market is slightly volatile, you will see a warning about the risk. You can c
FREE
Super Trend Channels MT4 Indicator Looking for a versatile and powerful channel indicator for your MetaTrader 4 trading platform? Look no further than the "Super Trend Channels" indicator! This advanced tool is designed to help traders identify trend channels accurately, enabling you to make informed trading decisions with confidence. Key Features: Multi-Channel Support: The "Super Trend Channels" indicator supports multiple channels simultaneously. You can visualize various channel types, inclu
Auto Fibo Retracement MT4
Nguyen Tuan Son
3.75 (4)
Auto Fibonacci Retracement Indicator — Flexible and Reliable This is not just another Auto Fibonacci Retracement indicator — it’s one of the most flexible and dependable tools available . If you find it useful, please leave a review or comment to support the project. Check out my other helpful tools below: Timeframes Trend Scanner    - Scan the trend of assets in difference timeframes with multiple indicators Market Trend Scanner   - Scan the trend of multiple-assets in with multiple indicators
FREE
The price is moving between two curve tunnel lines in a trend. The two lines of a tunnel represent support and resistance. In an uptrend, for instance, a trade might be entered at the support of the trend line (shown by the red line in the chart) and exited at resistance of the upper tunnel line (shown by the blue line). Tunnel show trend direction for any timeframe (if you have enough bars on the chart for higher timeframes). Trend, or price tunnel, can be up, down or sideways. If the current p
Indicador de Fibonacci Semanal para MT4 Maximize suas operações no mercado financeiro com o Indicador de Fibonacci Semanal para MetaTrader 4 (MT4) , a ferramenta essencial para traders que buscam identificar pontos estratégicos de suporte e resistência com base na ação do preço da última semana. Principais Recursos: Atualização Automática : O indicador recalcula os níveis de Fibonacci automaticamente a cada novo candle semanal. Níveis Personalizados : Traça apenas os níveis essenciais de Fibonac
FREE
Fibonacci Retracements Pro
Savia Forex Software Solutions
Fibonacci Retracements Pro The Fibonacci Retracements Pro is a powerful yet easy to use indicator. It automatically plots all the important Fibonacci retracement and extension levels for you. FRP is dynamic powerful and seamlessly adjusts to whatever timeframe you are analyzing. Fibonacci Retracement Pro is optimized for ALL timeframes and ALL Currency pairs, Indices, Commodities, and Cryptocurrency pairs. Trade with improved confidence and maximize your success rate. Benefits Dynamic and Power
Introduction to Fractal Moving Average Fractal Moving Average indicator was designed as part of Fractal Pattern Scanner. Inside Fractal Pattern Scanner, Fractal Moving Average Indicator was implemented as multiple of chart objects. With over thousands of chart object, we find that it was not the best and efficient ways to operate the indicator. It was computationally too heavy for the indicator. Hence, we decide to implement the indicator version of Fractal Moving Average indicator to benefit o
FREE
Newlevel
Sergey Nanov
Indicator. Zones of support and resistance levels The most reliable tool in the hands of any technical analyst is support and resistance levels.It is these levels that magically work in the market, because the price then bounces off them, on the contrary, gaining maximum acceleration, punching them and striving for a new price point.However, in practice, many beginners face enormous difficulties in building them.This is due to the fact that the price may react quite differently to them, and ofte
FREE
A Fibonacci indicator is best used with other indicators like Pivots, Support/Resistance etc. Price tends to use Fibo levels as Support or Resistance lines. So, this indicator is very useful to know when price might reverse or if a level is crossed, price might continue the trend. Also, to find the best Take Profit and StopLoss lines. Don't use Fibo Indicator alone for trading as it might not always be accurate. Use it to make your strategies better as a supporting indicator. Settings: Auto Fib
FREE
VR Pivot
Vladimir Pastushak
VR Pivot é um indicador de pontos pivôs importantes (pivot). Os Pontos Pivôs são um tipo especial de suporte (support) e níveis de resistência (resistance) que são usados para identificar as zonas de preço mais fortes. Os comerciantes profissionais usam os níveis de pivôs para determinar os preços em que há uma alta probabilidade de uma reversão de preço. Os níveis são calculados de acordo com fórmulas matemáticas especiais, os preços de fechamento, abertura, máximo, mínimo do período anterior s
Indicador de Bandas de Fibonacci para Metatrader 4 . Este indicador funciona de forma similar a las conocidas Bandas de Bollinger clásicas, pero en lugar de usar la desviación estándar para trazar las bandas usa números de Fibonacci y el ATR (Average True Range). Puede usarse para trazar niveles de soporte y resistencia que pueden emplearse en sistemas de scalping de corto plazo y swing trading.  Las bandas del indicador son calculadas de la siguiente forma: Línea central : Media móvil de n peri
FREE
MultiFiboDynamicMT4 is a powerful, professional indicator for estimating the most important support and resistance levels. The main advantage is that it plots the Fibonacci levels at all timeframes simultaneously, which allows the trader to see the full picture of the possible price movement of the trading instrument! Advantages of the indicator The indicator is perfect for scalping and trading binary options. Suitable for beginners and experienced traders. Works on all timeframes. Works on any
FREE
Double Fractal Entry Bot trades automatically using fractal breakouts or rebounds. It detects precise entry points, places SL and TP based on market structure, and includes logic to manage risk and avoid false signals. Simple, smart, and powerful. This product is also available for MetaTrader 5 =>  https://www.mql5.com/en/market/product/143608 Double Fractal Entry Bot is an intelligent trading robot based on the proven logic of the Double Fractal Entry indicator. It analyzes price using upper a
The   Pivot Point indicator   automatically calculates and displays the pivot point line and support and resistance levels. Pivot can be calculated according to the Classic, Floor, Fibonacci, Woodie, Camarilla or DeMark formula. It is also possible to select the period for calculating the indicator. A trader can choose from daily, weekly, monthly, or user-defined periods. Types of pivots Classic Floor Fibonacci Woodie Camarilla DeMark Main features The indicator shows the current and historic
FREE
Os compradores deste produto também adquirem
Gann Made Easy
Oleg Rodin
4.83 (162)
Gann Made Easy é um sistema de negociação Forex profissional e fácil de usar, baseado nos melhores princípios de negociação usando a teoria do sr. W. D. Gann. O indicador fornece sinais precisos de COMPRA e VENDA, incluindo níveis de Stop Loss e Take Profit. Você pode negociar mesmo em movimento usando notificações PUSH. Entre em contato comigo após a compra para receber instruções de negociação e ótimos indicadores extras gratuitamente! Provavelmente você já ouviu muitas vezes sobre os métodos
Scalper Inside PRO
Alexey Minkov
4.74 (69)
Scalper Inside PRO – Since 2020. An exclusive indicator that utilizes an innovative algorithm to swiftly and accurately determine the market trend. The indicator automatically calculates opening, closing, and profit levels, providing detailed trading statistics. With these features, you can choose the most appropriate trading instrument for the current market conditions. Additionally, you can easily integrate your own arrow indicators into Scalper Inside Pro to quickly evaluate their statistics
M1 Sniper
Oleg Rodin
5 (22)
O M1 SNIPER é um sistema indicador de negociação fácil de usar. É um indicador de seta projetado para o período M1. O indicador pode ser usado como um sistema independente para scalping no período M1 e pode ser usado como parte do seu sistema de negociação existente. Embora este sistema de negociação tenha sido projetado especificamente para negociação no M1, ele também pode ser usado em outros períodos. Originalmente, desenvolvi este método para negociar XAUUSD e BTCUSD. Mas considero-o útil ta
Sinal de tendência GoldRush Arrow O indicador Sinal de tendência GoldRush Arrow fornece uma análise precisa e em tempo real das tendências, adaptada para scalpers de alta velocidade e curto prazo em XAU/USD. Criada especificamente para o intervalo de tempo de 1 minuto, esta ferramenta exibe setas direcionais para pontos de entrada claros, permitindo que os scalpers naveguem em condições de mercado voláteis com confiança. O indicador consiste em setas de alerta PRIMÁRIAS e SECUNDÁRIAS. Os sin
KuKl
IGOR KIRIANEN
The indicator is built on a non-standard Zig Zag, it draws accumulations after which if the price leaves this zone and a test of this zone occurs, then a sound signal is given and an arrow appears - after the test candle closes.The indicator does not redraw its signals, it is very easy to use, there are only three settings 1- this is the zig zag parameter 2- this is the minimum price exit from the zone 3- this is the maximum price exit from the zone. The lower the parameter for Zig Zag, the more
O sistema PRO Renko é um sistema de negociação altamente preciso especialmente concebido para a negociação de gráficos RENKO. Trata-se de um sistema universal que pode ser aplicado a vários instrumentos de negociação. O sistema neutraliza eficazmente o chamado ruído de mercado, dando-lhe acesso a sinais de inversão precisos. O indicador é muito fácil de usar e tem apenas um parâmetro responsável pela geração de sinal. Você pode facilmente adaptar a ferramenta a qualquer instrumento de negocia
Um indicador técnico que estrutura gráficos e identifica movimentos cíclicos de preços. Pode funcionar em qualquer gráfico. Vários tipos de notificações. Existem setas adicionais no próprio gráfico. Sem redesenhar a história, trabalha no fecho da vela. TF recomendado a partir de M5 e superior. Parâmetros fáceis de utilizar e configurar. Ao utilizar 2 indicadores com parâmetros diferentes, pode utilizá-los sem outros indicadores. Tem 2 parâmetros de entrada Ciclicidade e duração do sinal Estes
Market Makers
Mohamed Hassan
5 (4)
After purchase, contact me privately to receive 1 month of free testing with EA Forex Proton! This advanced MT4 trading robot automatically executes signals from any MT4 indicator, including Market Makers. The latest version also includes AI integration, allowing each trade signal to be analyzed using Artificial Intelligence. Live Signal with EA Forex Proton: Click here Market Makers is a powerful price action trading system designed to identify high-probability Buy and Sell opportunities based
ACTUALMENTE 40% DE DESCONTO!! A melhor solução para qualquer novato ou comerciante especializado! Este indicador é uma ferramenta comercial única, de alta qualidade e acessível, porque incorporámos uma série de características proprietárias e uma fórmula secreta. Com apenas UM gráfico, dá alertas para todos os 28 pares de moedas. Imagine como a sua negociação irá melhorar porque é capaz de identificar o ponto exacto de desencadeamento de uma nova tendência ou oportunidade de escalada! Constr
Atomic Analyst
Issam Kassas
5 (5)
Primeiramente, vale ressaltar que este Indicador de Negociação não repinta, não redesenha e não apresenta atrasos, tornando-o ideal tanto para negociação manual quanto automatizada. Manual do utilizador: configurações, entradas e estratégia. O Analista Atômico é um Indicador de Ação de Preço PA que utiliza a força e o momentum do preço para encontrar uma vantagem melhor no mercado. Equipado com filtros avançados que ajudam a remover ruídos e sinais falsos, e aumentam o potencial de negociação.
Advanced Supply Demand
Bernhard Schweigert
4.91 (300)
Atualmente com 40% de desconto! A melhor solução para qualquer Trader Novato ou especialista! Este indicador é uma ferramenta de negociação exclusiva, de alta qualidade e acessível porque incorporamos uma série de recursos proprietários e uma nova fórmula. Com esta atualização, você poderá mostrar fusos horários duplos. Você não só será capaz de mostrar um TF mais alto, mas também mostrar ambos, o TF do gráfico, MAIS o TF mais alto: MOSTRANDO ZONAS ANINHADAS. Todos os traders de Oferta e Demanda
ACTUALMENTE COM 40% DE DESCONTO A melhor solução para qualquer novato ou comerciante especializado! Este Indicador é uma ferramenta comercial única, de alta qualidade e acessível, porque incorporámos uma série de características proprietárias e uma nova fórmula. Com apenas UM gráfico, pode ler a força da moeda para 28 pares de Forex! Imagine como a sua negociação irá melhorar porque é capaz de apontar o ponto exacto do gatilho de uma nova tendência ou oportunidade de escalada? Manual do util
Apex Edge No Repaint Indicador de negociação profissional sem repintura para MT4 O Apex Edge No Repaint é uma ferramenta de negociação premium, clara e fiável, concebida para traders de forex e criptomoedas que procuram sinais claros e sem a frustração de setas que repintam. Principais Características: 100% Sem Repintura – Os sinais permanecem fixos assim que aparecem no gráfico Sistema de sinal duplo: sinais RAW para oportunidades iniciais e sinais CONF para entradas confirmadas de alta pro
RFI levels PRO
Roman Podpora
5 (1)
O indicador mostra com precisão os pontos de reversão e as zonas de retorno de preço onde o   Principais players . Você identifica onde novas tendências estão se formando e toma decisões com máxima precisão, mantendo o controle sobre cada negociação. VERSION MT5     -     Revela seu potencial máximo quando combinado com o indicador   TREND LINES PRO. O que o indicador mostra: Estruturas de reversão e níveis de reversão com ativação no início de uma nova tendência. Exibição dos níveis de   TAKE
Este indicador foi projetado para se integrar com a teoria das Ondas de Elliott, oferecendo dois métodos distintos de operação: Trabalho Automático: Nesse modo, o indicador opera autonomamente detectando todas as cinco ondas motrizes no gráfico de acordo com a teoria das Ondas de Elliott. Ele oferece previsões e identifica zonas potenciais de reversão. Além disso, possui a capacidade de gerar alertas e mensagens de push para notificar os traders sobre desenvolvimentos significativos. Essa funcio
Auto Optimized Parabolic RSI: Avançado Motor de Momentum 3D A maioria dos indicadores de varejo falha porque depende de parâmetros estáticos que quebram no momento em que a volatilidade do mercado muda. O Auto Optimized Parabolic RSI resolve o problema de "obsolescência do indicador" recalculando continuamente a sua própria vantagem matemática, trazendo uma adaptação quantitativa de nível institucional diretamente para o seu terminal MT5. A Vantagem Principal: Otimização 3D em Memória Personaliz
Se você comprar este indicador, receberá meu Gerenciador de Operações Profissional   + EA  GRATUITAMENTE. Primeiramente, vale ressaltar que este Sistema de Trading é um Indicador Não Repintado, Não Redesenho e Não Atrasado, o que o torna ideal tanto para o trading manual quanto para o automatizado. Curso online, manual e download de predefinições. O "Sistema de Trading Inteligente MT5" é uma solução completa de trading projetada para traders novos e experientes. Ele combina mais de 10 indicador
O indicador " Dynamic Scalper System " foi desenvolvido para o método de scalping, operando dentro de ondas de tendência. Testado nos principais pares de moedas e ouro, é possível a compatibilidade com outros instrumentos de negociação. Fornece sinais para a abertura de posições de curto prazo ao longo da tendência, com suporte adicional para o movimento dos preços. O princípio do indicador: As setas grandes determinam a direção da tendência. Um algoritmo para gerar sinais de scalping sob a fo
GOLD Impulse with Alert
Bernhard Schweigert
4.67 (12)
Este indicador é uma super combinação dos nossos 2 produtos Advanced Currency IMPULSE with ALERT  +   Currency Strength Exotics . Funciona para todos os períodos de tempo e mostra graficamente impulso de força ou fraqueza para as 8 principais moedas mais um Símbolo! Este Indicador é especializado para mostrar a aceleração da força da moeda para quaisquer símbolos como Ouro, Pares Exóticos, Commodities, Índices ou Futuros. É o primeiro do seu género, qualquer símbolo pode ser adicionado à 9ª
Scalping Lines System -  é um sistema de scalping concebido especificamente para negociar o ativo Ouro (XAUUSD) em timeframes de M1 a H1. Combina indicadores de tendência, volatilidade e análise de mercado de sobrecompra/sobrevenda, reunidos num único oscilador para identificar sinais de curto prazo. Os principais parâmetros internos das linhas de sinal estão pré-configurados. Alguns parâmetros permanecem para ajuste manual: "Duração da Onda de Tendência", que regula a duração de uma série de
O Detetor de Terremoto do Mercado  Sismógrafo. Description in English : https://www.mql5.com/en/market/product/113869?source=Site+Market+Product+Page#description How to use the Seismograph : https://www.mql5.com/en/market/product/113869#!tab=comments&page=2&comment=52806941 Create an EA : https://www.mql5.com/en/market/product/113869#!tab=comments&page=3&comment=52816509 Seja qual for a maneira como você negocia, você definitivamente quer evitar a entrada no mercado de baixa liquidez.- O
KURAMA GOLD SIGNAL PRO (MT4) — Sistema completo XAUUSD com filtro de 7 camadas SEM REPAINT SEM REDESENHO SEM ATRASO Cada sinal é permanente. BÔNUS: Compre a licença vitalícia e receba AI Zone Radar ($59) + manual PDF GRÁTIS. Envie mensagem após a compra. AI Zone Radar: https://www.mql5.com/en/market/product/175834 7 FILTERS 7 filtros independentes: Volatilidade, Estrutura MA, Direção tendência, Ângulo MA, Timeframe H4, RSI, Bloqueio penetração. A maioria usa 1-2 filtros. Es
Trend Screener
STE S.S.COMPANY
4.79 (95)
Indicador de tendência, solução única inovadora para negociação e filtragem de tendências com todos os recursos de tendências importantes construídos dentro de uma ferramenta! É um indicador multi-timeframe e multi-moedas 100% sem repintura que pode ser usado em todos os símbolos/instrumentos: forex, commodities, criptomoedas, índices e ações. OFERTA POR TEMPO LIMITADO: O indicador Support and Resistance Screener está disponível por apenas US$ 65 vitalício. (Preço original US$ 250) (oferta esten
Super Signal – Skyblade Edition Sistema profissional de sinais de tendência sem repintar / sem atraso com taxa de acerto excepcional | Para MT4 / MT5 Funciona melhor em timeframes mais curtos, como 1 minuto, 5 minutos e 15 minutos. Principais características: Super Signal – Skyblade Edition é um sistema inteligente de sinais desenvolvido especificamente para operações com tendência. Utiliza uma lógica de filtragem em múltiplas camadas para detectar apenas movimentos direcionais fortes sustenta
CRYSTAL HEIKIN ASHI SIGNALS MT4 Professional Trend Detection Indicator with Smart Entry Signals See the Trend. Catch the Move. Trade with Confidence. The professional Heikin Ashi indicator built for traders who want clarity, precision, and EA-ready signal automation. WHAT IS CRYSTAL HEIKIN ASHI SIGNALS? Crystal Heikin Ashi Signals is a professional-grade MetaTrader 4 indicator that combines pure Heikin Ashi candle visualization with an advanced momentum-shift detection system. Designed for both
Indicador NextCandlePredictor NextCandlePredictor, um indicador de sinal com alerta que não repinta, não muda de cor, não se move, não desaparece e não tem lag. Ele ajudará a identificar a direção da próxima ou próximas velas em qualquer período de tempo. Altamente recomendado para mercados de alta volatilidade, como Nova York, Londres ou até mesmo a sobreposição de ambos. Principais Características: Versatilidade em Timeframes: Fornece sinais rápidos e precisos em qualquer timeframe, de M1 a H1
Full Scalping Signal
Leandro Bernardez Camero
FullScalping é um indicador não repintante e não retroativo , especialmente projetado para gerar entradas de scalping CONSTANTES em qualquer mercado. Perfeito para traders agressivos que buscam ação ininterrupta! Junte-se ao canal para ficar atualizado com informações exclusivas e atualizações: https://www.mql5.com/en/channels/forexnewadvisor Você notará que ele dá sinais em quase toda vela , seja confirmando a tendência ou sinalizando retrações-chave. É como ter um radar constantemente guiand
Special offer : ALL TOOLS , just $35 each! New tools   will be   $30   for the   first week   or the   first 3 purchases !  Trading Tools Channel on MQL5 : Join my MQL5 channel to update the latest news from me O Fibonacci Confluence Toolkit Multi-Timeframe é uma ferramenta avançada de análise técnica projetada para traders profissionais, ajudando a identificar zonas potenciais de reversão de preços ao combinar sinais e padrões de mercado-chave. Com capacidades de exibição de múltiplos interval
O Apollo SR Master é um indicador de Suporte/Resistência com recursos especiais que tornam a negociação com zonas de Suporte/Resistência mais fácil e confiável. O indicador calcula as zonas de Suporte/Resistência em tempo real, sem qualquer atraso, detectando topos e fundos de preço locais. Em seguida, para confirmar a área de Suporte/Resistência recém-formada, o indicador exibe um sinal especial que indica que a zona pode ser considerada e usada como um sinal de VENDA ou COMPRA. Nesse caso, a f
Trend Scanner PRO First of all, it’s worth emphasizing that this trading system is 100% Non-Repainting, Non-Redrawing, and Non-Lagging , which makes it ideal for both   manual   and   algorithmic   trading setups. Online course, user manual, and downloadable presets included. The Trend Scanner Dashboard is a professional   multi pair scanner   that analyzes multiple symbols and timeframes at once, giving you an instant   market scanner   view of the real trend direction. Instead of switching ch
Mais do autor
StarBody
Gabriele Tedeschi
StarBody è un indicatore istogramma che rappresenta la dimensione delle candele in relazione al loro volume ed evidenzia quelle più grandi delle precedenti. La formula per il calcolo dell'altezza dell'istogramma è semplice quanto efficace: Ampiezza * Volume La grafica indicherà tutte le candele più estese delle precedenti in base alle impostazioni scelte. L'indicatore può essere utile, a volte indispensabile, nelle strategie che prevedono lo sfruttamento della continuazione del trend. Le strate
FREE
PastProjection
Gabriele Tedeschi
Quante volte ti è capitato di aver bisogno di avere a grafico i livelli chiave di una candela chiusa del time frame precedente? Con PastProjection potrai far disegnare i livelli di Apertura, Chiusura, Massimo e Minimo della candela chiusa al time frame superiore scelto. I livelli sono spesso importanti e diventano supporti o resistenze, o entrambi. La prima volta che vengono raggiunti spesso fanno reagire la quotazione. I pattern su questi livelli sono spesso più efficaci. Tali livelli sono sign
FREE
StarTrend
Gabriele Tedeschi
StarTrend è un indicatore a freccia che identifica, con alta probabilità, l'inizio di un nuovo trend.  La sua versatilità, però, permette di utilizzarlo anche in strategia in cui cerchiamo operazioni a favore di trend. StarTrend può essere la base del proprio sistema di trading oppure può integrare, per dare conferme o suggerimenti di astensione, il tuo sistema già collaudato. StarTrend invia segnali di preallarme quando c'è un probabile rallentamento della forza del trend e poi disegna una stel
CollapseStar
Gabriele Tedeschi
COLLAPSE STAR is an EA based on a contrarian trading system but still takes advantage of the accelerations in favor with an intelligent trailing system. COLLAPSE STAR is always on the market, accumulating earnings every day. With composite interest it allows an exponential growth of your capital. It is a mediated system but it is not a grid system. COLLAPSE STAR enters the market when the trade is most likely to be profitable. COLLAPSE STAR is not a martingale: an increase in volumes is planned
StarSwing
Gabriele Tedeschi
StarSwing è un indicatore NO REPAINT che unisce in un unico strumento oscillatori e indicatori di forza.  I parametri esterni permettono di bilanciare il peso delle componenti e di regolare a proprio piacimento l'indicatore stesso. StarSwing, graficamente, è composto da segmenti di 2 colori: uno rappresentante il rialzo e uno il ribasso. Il colore non dipende dalla pura direzione del segmento ma dal trend di fondo calcolato dall'indicatore stesso. Sul grafico, si può far disegnare una media mobi
StarBounce
Gabriele Tedeschi
StarBounce è un indicatore NO REPAINT che sfrutta i livelli importanti dei timeframe superiori.  StarBounce disegna i livelli di Apertura, Chiusura, Massimo e Minimo delle candele di uno specifico timeframe e su questi livelli cerca dei re-test. Si cercano candele con corpo sopra/sotto un livello e minimo/massimo oltre il medesimo livello. Si possono filtrare le candele segnale con diversi filtri selezionabili, attivabili, disattivabili con variabili esterne. Number of trending candles: permette
StarPlatform
Gabriele Tedeschi
StarPlatform è un EA a pulsantiera che permette di aprire e, automaticamente, gestire e chiudere ordini.   Apertura di posizione. StarPlatform permette di aprire ordini a mercato e/o piazzare pendenti di tipo LIMIT e STOP. I pendenti possono avere il livello d’ingresso posizionato manualmente oppure calcolato automaticamente in quanto ancorato ai massimi o ai minimi della candela su cui si clicca. Ogni ordine può avere lo Stop Loss piazzato con le stesse modalità del livello d’ingresso (impostat
Filtro:
Sem comentários
Responder ao comentário